| MSI N450GTS Cyclone 1GD5/OC Video Card |
| Reviews - Featured Reviews: Video Cards | ||||||||||||||||||||||||||||||||||||||||||||||||||||||||||||||||||||||||||||||||||||||||||||||||||||||||||||||||||||||||||||||||||||||||||||||||||||||||||||||||||||||||||||||||||||||||||||||||||||||||||||||||||||||||||||||||||||||||||||||||||||||||||||||||||||||||||||||||||||||||||||||||||||||||||||||||||||||||||||
| Written by Hank Tolman | ||||||||||||||||||||||||||||||||||||||||||||||||||||||||||||||||||||||||||||||||||||||||||||||||||||||||||||||||||||||||||||||||||||||||||||||||||||||||||||||||||||||||||||||||||||||||||||||||||||||||||||||||||||||||||||||||||||||||||||||||||||||||||||||||||||||||||||||||||||||||||||||||||||||||||||||||||||||||||||
| Thursday, 11 November 2010 | ||||||||||||||||||||||||||||||||||||||||||||||||||||||||||||||||||||||||||||||||||||||||||||||||||||||||||||||||||||||||||||||||||||||||||||||||||||||||||||||||||||||||||||||||||||||||||||||||||||||||||||||||||||||||||||||||||||||||||||||||||||||||||||||||||||||||||||||||||||||||||||||||||||||||||||||||||||||||||||
MSI N450GTS Cyclone 1GD5/OC Video Card ReviewThere are a lot of new options coming into this holiday season and it looks like NVIDIA's newly released GTX 580 video card is set to make a splash. But not everyone is ready for a $500 graphics solution. Many consumers will likely not even come close to using the potential of such a video card. For those PC Gamers who are a little more casual, but still like to immerse themselves in a high quality graphics experience, something a little less pricey might be on your list this year. Both AMD and NVIDIA have some powerful offerings in the mid-range price segment. Recently we looked at a Radeon HD 5770 that came overclocked from the factory with a cooling design touted as quite a bit better than the reference. Now it is NVIDIA's turn and Benchmark Reviews has the MSI N450GTS Cyclone 1GD5/OC GTS 450 video card. MSI has offered video cards with the Cyclone designation for a long time now on both their ATI and NVIDIA products. The Cyclone design refers to the fan and heatsink combination that fits onto to the card. For the MSI N450GTS Cyclone 1GD5/OC, MSI claims that the cyclone design can bring down the temperature of the video card, making it up to 17 degrees cooler than the reference design. The GTS 450 is already a very cool running video card, and a very good overclocker. An additional 17 degrees cooler would make it ideal for tightly enclosed cases with low ventilation or for the would-be overclocker.
The GTS 450 line of video cards competes pretty directly with the Radeon HD 5770 line. Due to recent releases of newer graphics solutions, the price of both series' has fallen somewhat. Benchmark Reviews recently looked at a $145 Radeon HD 5770 that boasted many of the same features of the MSI N450GTS Cyclone; cooler temperatures and a factory overclock specifically. At $140, the MSI N450GTS Cyclone competes directly with the PowerColor Radeon HD 5770 AX5770 PCS+ in price. Throughout this article we will be able to see if it also competes directly in performance.
Manufacturer: Micro-Star International Corporation, LTD. Full Disclosure: The product sample used in this article has been provided by MSI. Closer Look: MSI GeForce GTS 450You generally know what to expect in terms of appearance when you think of a Cyclone card from MSI. The familiar fan and heatsink combination has graced a lot of MSI video cards and the MSI N450GTS Cyclone is no different. This design has been successful in helping reduce temperatures in the past and we expect no difference with the MSI N450GTS Cyclone 1GD5/OC. The body of the MSI N450GTS Cyclone is not much different than the GTS 450 reference design. The card is about 8 1/4" in length, 4 1/4" tall, and about an inch and half wide.
The MSI N450GTS was packed snugly into a foam casing inside the box. The contents of the packaging included a VGA/DVI adapter, an mini HDMI to HDMI adapter, a MOLEX to PCI-E 6-Pin adapter, a users manual, a user's guide, a driver CD, and a download code for the demo version of Starcraft 2. While it sounds like a lot when written out like that, it really doesn't take up much space inside the box. The driver CD comes with some neat features such as MSI Afterburner and Kombuster. We will use Afterburner a little later on to overclock the MSI N450GTS Cyclone. Kombuster is a version of FurMark that uses the MSI logo as its furry graphical rendering. It supports DX11 and tesselation, allowing it to thoroughly stress a GPU.
The I/O panel on the MSI N450GTS Cyclone 1GD5/OC follows not only the trend of the GTS 450 series cards, but also of most of the GeForce 400 series cards. There are two dual-link DVI ports and a mini HDMI 1.4 port to choose from. This will allow you to connect up to two monitors to the MSI N450GTS Cyclone. If you are looking for the NVIDIA 3D Surround experience, you will need another card connected in SLI to achieve it. The MSI N450 GTS Cyclone will take up two of your PCI slots. The one without any connectors has vents cut into the metal. Depending on how you direct the airflow in your case, this might help as another avenue of exhaust. It won't help much as far as exhausting the warm air from the actual card goes, however. The Cyclone cooling system strays from the reference design in that it doesn't have a full casing that forces air out of these vents. In all reality, with the MSI N450GTS Cyclone, these vents are just cosmetic, as the card doesn't put out a lot of heat as it is.
The MSI N450GTS Cyclone requires only a single 6-Pin PCI-E input from your power supply. This will allow the MSI N450GTS Cyclone to pull up to an additional 75W of power over the 75W provided by the PCI-E slot. With that, the maximum power draw of the GTS 450 video card can't exceed 150W. Like all of the cards in the GTS 450 series, the MSI N450GTS Cyclone has a single SLI connector. You can only have up to two GTS 450 cards in SLI in your system.
MSI has had a lot of success with their Cyclone design, so there really is no need to change it. MSI didn't take a lot of liberty with the reference design PCB either. If it's not broke, don't fix it, just overclock it. That seems to be the motto here. N450GTS Cyclone Detailed FeaturesWith the covers pulled off, the MSI N450GTS Cyclone looks nearly identical to the reference design. That's not a bad thing. As we have seen in previous GTS 450 reviews, the GF106 based video cards are very well equipped to handle the challenges that face the mid-range market. The one thing MSI chose to hone in on was the overclock headroom found in the GTS 450. With the N450GTS Cyclone 1GD5/OC, they have bumped up both the GPU core/shader core speed as well as the memory speed.
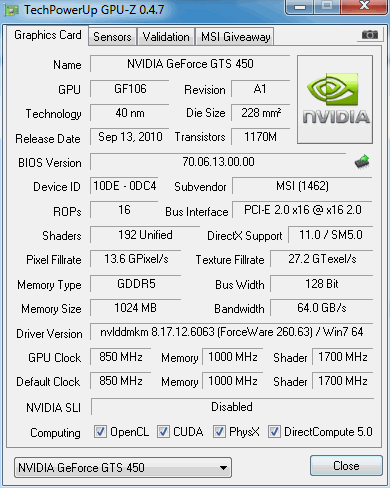
Your run-of-the-mill GTS 450 comes with a clock speed of 783MHz with double that, 1566MHz, for the CUDA cores. The MSI N450GTS Cyclone increases that by about 8.5% to an 850MHz graphics clock and 1700MHz for the CUDA cores. They also overclocked the memory, and we'll see that in just a minute. The overclocked GF106 chip and GDD5 memory are powered by the reference VRM design. It consists of three power phases and utilizes solid capacitors. 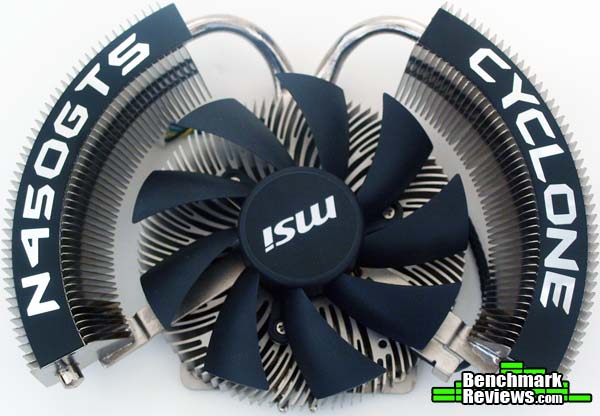
The Cyclone fan and heatsink design is a familiar one. The 9-bladed fan sits atop a radial heatsink that pushes excess heat through two heat-pipes to a pair of curved heatsinks housed on either side of the fan. The fan is located in a great location to cool the fins of the heatsink quite well. The design obviously works, and that's why MSI uses it time and time again. 
The MSI N450GTS Cyclone 1GD5/OC uses the same Samsung K4G10325FE-HC05 chips as the reference design and many other manufacturers cards. These memory modules are rated at 1000MHz, or a effective speed of 4000MHz. On the reference, however, the memory clock is set to 900MHz. MSI changed that with the N450GTS Cyclone and clocked the memory at the rated speed of 1000MHz. When we get to our overclocking section, you will notice that we didn't change that during our overclocking.
MSI shows off a very good manufacturing process with the N450GTS Cyclone 1GD5/OC. In the picture above, you can see one of the most crowded parts of the PCB, directly behind the GPU. With such precise placement, it is often difficult to avoid splash and to clean off left over residue after soldering, especially while maintaining environmental standards. MSI performs as we would expect they should and each of the components is located in its appropriate place and with no residual solder left behind where it shouldn't be. VGA Testing MethodologyThe Microsoft DirectX-11 graphics API is native to the Microsoft Windows 7 Operating System, which is the primary O/S for our test platform. DX11 is also available as a Microsoft Update for the Windows Vista O/S, so our test results apply to both versions of the Operating System. Many of benchmark tests used in this article are comparative to DX11 performance, however some high-demand DX10 tests have also been included. According to the Steam Hardware Survey published for the month ending September 2010, the most popular gaming resolution is 1680x1050 (22-24" widescreen LCD) with 1280x1024 (17-19" standard LCD monitors) close behind. Here at Benchmark Reviews, we like to push things a little further, so our tests will be conducted at 1920x1080. Most of the tests will also include results at 1680x1050. Our site polls and statistics indicate that the over 90% of our visitors use their PC for playing video games, and practically every one of you are using a screen resolutions mentioned above. Since all of the benchmarks we use for testing represent different game engine technology and graphic rendering processes, this battery of tests will provide a diverse range of results for you to gauge performance on your own computer system. A combination of synthetic and video game benchmark tests have been used in this article to illustrate relative performance among graphics solutions. Our benchmark frame rate results are not intended to represent real-world graphics performance, as this experience would change based on supporting hardware and the perception of individuals playing the video game. At the start of all tests, the previous display adapter driver is uninstalled and trace components are removed using Driver Cleaner Pro. We then restart the computer system to establish our display settings and define the monitor. Once the hardware is prepared, we begin our testing. In each benchmark test there is one 'cache run' that is conducted, followed by five recorded test runs. Results are collected at each setting with the highest and lowest results discarded. The remaining three results are averaged, and displayed in the performance charts on the following pages. DX11 Cost to Performance Ratio
|
||||||||||||||||||||||||||||||||||||||||||||||||||||||||||||||||||||||||||||||||||||||||||||||||||||||||||||||||||||||||||||||||||||||||||||||||||||||||||||||||||||||||||||||||||||||||||||||||||||||||||||||||||||||||||||||||||||||||||||||||||||||||||||||||||||||||||||||||||||||||||||||||||||||||||||||||||||||||||||


|
Graphics Card |
GeForce 9800 GTX+ |
GeForce GTX285 |
GeForce GTS450 |
PowerColorRadeon HD 5770 PPG |
|
GPU Cores |
128 |
240 |
192 |
800 |
|
Core Clock (MHz) |
740 |
670 |
850 |
875 |
|
Shader Clock (MHz) |
1836 |
1550 |
1700 |
N/A |
|
Memory Clock (MHz) |
1100 |
1300 |
1000 |
1225 |
|
Memory Amount |
512 MB GDDR3 |
1024MB GDDR3 |
1024MB GDDR3 |
1024MB GDDR5 |
|
Memory Interface |
256-bit |
512-bit |
128-bit |
128-bit |
DX10: 3DMark Vantage
3DMark Vantage is a PC benchmark suite designed to test the DirectX10 graphics card performance. FutureMark 3DMark Vantage is the latest addition the 3DMark benchmark series built by FutureMark corporation. Although 3DMark Vantage requires NVIDIA PhysX to be installed for program operation, only the CPU/Physics test relies on this technology.
3DMark Vantage offers benchmark tests focusing on GPU, CPU, and Physics performance. Benchmark Reviews uses the two GPU-specific tests for grading video card performance: Jane Nash and New Calico. These tests isolate graphical performance, and remove processor dependence from the benchmark results.
3DMark Vantage GPU Test: Jane Nash
Of the two GPU tests 3DMark Vantage offers, the Jane Nash performance benchmark is slightly less demanding. In a short video scene the special agent escapes a secret lair by water, nearly losing her shirt in the process. Benchmark Reviews tests this DirectX-10 scene at 1920x1080 and 1680x1050 resolutions, and uses high quality settings with 8x anti-aliasing and 16x anisotropic filtering. The 1:2 scale is utilized, and is the highest this test allows. These settings allow for the GPUs in the test to be stressed sufficiently.

Cost Analysis: Jane Nash (1920x1080)
- $115 GeForce GTS 250 512MB (9800GTX+) = $11.48 per FPS
- $140 GeForce GTS 450 1GB (MSI Cyclone) = $8.97 per FPS
- $145 Radeon HD 5770 1GB (PowerColor 1GBD5-PPVG2) = $8.90 per FPS
- $260 GeForce GTX 285 1GB = $13.42 per FPS
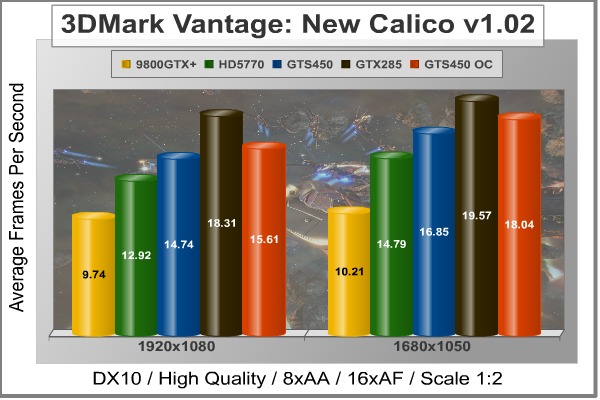
3DMark Vantage GPU Test: New Calico
New Calico is the second GPU test in the 3DMark Vantage test suite. Of the two GPU tests, New Calico is the most demanding. In a short video scene featuring a galactic battleground, there is a massive display of busy objects across the screen. Benchmark Reviews tests this DirectX-10 scene at 1920x1080 and 1680x1050 resolutions, and uses high quality settings with 8x anti-aliasing and 16x anisotropic filtering. The 1:2 scale is utilized, and is the highest this test allows.
Cost Analysis: New Calico (1920x1080)
- $115 GeForce GTS 250 512MB (9800GTX+) = $11.81 per FPS
- $140 GeForce GTS 450 1GB (MSI Cyclone) = $9.50 per FPS
- $145 Radeon HD 5770 1GB (PowerColor 1GBD5-PPVG2) = $11.22 per FPS
- $260 GeForce GTX 285 1GB = $13.42 per FPS
Test Summary: The 3DMark Vantage tests thoroughly stress even the strongest GPUs, as can be witnessed by the less than stellar 19.37 FPS in the Jane Nash test achieved by our strongest GPU in the testbed, the GTX 285. The two GPU tests in the 3DMark Vantage suite seem torn when it comes to deciding a winner between the similarly priced Radeon HD 5770 and the MSI N450GTS Cyclone. In the Jane Nash test, the Radeon HD 5770 ekes out slight gains over the MSI N450GTS Cyclone, but in amounts of less than 1 FPS. Still, at these low frames, the Radeon is more than 4% faster than the GTS 450, putting it outside of the margin of error. In the Calico tests, the MSI N450GTS Cyclone outperforms the Radeon HD 5770 by nearly 14% at 1920x1080. Through the 3DMark Vantage tests, it's difficult to decide a winner, but the slightly lower price of the MSI N450GTS Cyclone and its performance in the more challenging Calico test give it a better cost per FPS ratio.
|
Graphics Card |
GeForce 9800 GTX+ |
GeForce GTX285 |
GeForce GTS450 |
PowerColorRadeon HD 5770 PPG |
|
GPU Cores |
128 |
240 |
192 |
800 |
|
Core Clock (MHz) |
740 |
670 |
850 |
875 |
|
Shader Clock (MHz) |
1836 |
1550 |
1700 |
N/A |
|
Memory Clock (MHz) |
1100 |
1300 |
1000 |
1225 |
|
Memory Amount |
512 MB GDDR3 |
1024MB GDDR3 |
1024MB GDDR3 |
1024MB GDDR5 |
|
Memory Interface |
256-bit |
512-bit |
128-bit |
128-bit |
DX10: Street Fighter IV
Capcom's Street Fighter IV is part of the now-famous Street Fighter series that began in 1987. The 2D Street Fighter II was one of the most popular fighting games of the 1990s, and now gets a 3D face-lift to become Street Fighter 4. The Street Fighter 4 benchmark utility was released as a novel way to test your system's ability to run the game. It uses a few dressed-up fight scenes where combatants fight against each other using various martial arts disciplines. Feet, fists and magic fill the screen with a flurry of activity. Due to the rapid pace, varied lighting and the use of music this is one of the more enjoyable benchmarks.
Street Fighter IV uses a proprietary Capcom SF4 game engine, which is enhanced over previous versions of the game. In terms of 3D graphical demand, Street Fighter IV is considered very low-end for most desktop GPUs. While modern desktop computers with discrete graphics have no problem playing Street Fighter IV at its highest graphical settings, integrated and mobile GPUs have a difficult time producing playable frame rates with the lowest settings configured.
- Street Figher IV Benchmark (High Quality, 8x AA, 16x AF, Parallel Rendering)

Cost Analysis: Street Fighter IV (1920x1080)
- $115 GeForce GTS 250 512MB (9800GTX+) = $1.75 per FPS
- $140 GeForce GTS 450 1GB (MSI Cyclone) = $1.64 per FPS
- $145 Radeon HD 5770 1GB (PowerColor 1GBD5-PPVG2) = $1.97 per FPS
- $260 GeForce GTX 285 1GB = $2.53 per FPS
Test Summary: The Capcom title Street Fighter IV isn't very demanding on any of the video cards tested, but it can give us a good idea of what most games will probably play like using this hardware. We like to push our hardware to the limit with some of the most demanding titles, but the truth is most games don't require nearly as much from your hardware. In the Street Fighter IV benchmark, the MSI N450GTS Cyclone once again outperforms the Radeon HD 5770, and this time at a much higher amount of over 16%.
|
Graphics Card |
GeForce 9800 GTX+ |
GeForce GTX285 |
GeForce GTS450 |
PowerColorRadeon HD 5770 PPG |
|
GPU Cores |
128 |
240 |
192 |
800 |
|
Core Clock (MHz) |
740 |
670 |
850 |
875 |
|
Shader Clock (MHz) |
1836 |
1550 |
1700 |
N/A |
|
Memory Clock (MHz) |
1100 |
1300 |
1000 |
1225 |
|
Memory Amount |
512 MB GDDR3 |
1024MB GDDR3 |
1024MB GDDR3 |
1024MB GDDR5 |
|
Memory Interface |
256-bit |
512-bit |
128-bit |
128-bit |
DX10: Far Cry 2
Ubisoft has developed Far Cry 2 as a sequel to the original, but with a very different approach to game play and story line. Far Cry 2 features a vast world built on Ubisoft's new game engine called Dunia, meaning "world", "earth" or "living" in Farci. The setting in Far Cry 2 takes place on a fictional Central African landscape, set to a modern day timeline.
The Dunia engine was built specifically for Far Cry 2, by Ubisoft Montreal development team. It delivers realistic semi-destructible environments, special effects such as dynamic fire propagation and storms, real-time night-and-day sun light and moon light cycles, dynamic music system, and non-scripted enemy A.I actions.
The Dunia game engine takes advantage of multi-core processors as well as multiple processors and supports DirectX 9 as well as DirectX 10. Only 2 or 3 percent of the original CryEngine code is re-used, according to Michiel Verheijdt, Senior Product Manager for Ubisoft Netherlands. Additionally, the engine is less hardware-demanding than CryEngine 2, the engine used in Crysis. However, it should be noted that Crysis delivers greater character and object texture detail, as well as more destructible elements within the environment. For example; trees breaking into many smaller pieces and buildings breaking down to their component panels. Far Cry 2 also supports the amBX technology from Philips. With the proper hardware, this adds effects like vibrations, ambient colored lights, and fans that generate wind effects.
There is a benchmark tool in the PC version of Far Cry 2, which offers an excellent array of settings for performance testing. Benchmark Reviews used the maximum settings allowed for our tests, with the resolution set to 1920x1080 and 1680x1050. The performance settings were all set to 'Very High', Render Quality was set to 'Ultra High' overall quality level, 8x anti-aliasing was applied, and HDR and Bloom were enabled. Of course DX10 was used exclusively for this series of tests.

Cost Analysis: Far Cry 2 (1920x1080)
- $115 GeForce GTS 250 512MB (9800GTX+) = $4.80 per FPS
- $140 GeForce GTS 450 1GB (MSI Cyclone) = $3.35 per FPS
- $145 Radeon HD 5770 1GB (PowerColor 1GBD5-PPVG2) = $4.69 per FPS
- $260 GeForce GTX 285 1GB = $3.98 per FPS
Test Summary: Far Cry 2 may use the same Dunia engine that Crysis uses, but the benchmark is generally less taxing than the Crysis benchmark. It is still pretty demanding at ultra high performance settings for our mid-range GPUs. The Radeon HD 5770 only gets frame rates slightly above what is considered playable. The MSI N450GTS GTS 450, on the other hand, beats the Radeon HD 5770 by more than 10 FPS in both at 1920x1080 and 1680x1050. So far the DX10 tests are favoring the Fermi card over the Radeon HD 5770, even when both come with a factory overclock.
|
Graphics Card |
GeForce 9800 GTX+ |
GeForce GTX285 |
GeForce GTS450 |
PowerColorRadeon HD 5770 PPG |
|
GPU Cores |
128 |
240 |
192 |
800 |
|
Core Clock (MHz) |
740 |
670 |
850 |
875 |
|
Shader Clock (MHz) |
1836 |
1550 |
1700 |
N/A |
|
Memory Clock (MHz) |
1100 |
1300 |
1000 |
1225 |
|
Memory Amount |
512 MB GDDR3 |
1024MB GDDR3 |
1024MB GDDR3 |
1024MB GDDR5 |
|
Memory Interface |
256-bit |
512-bit |
128-bit |
128-bit |
DX10: Resident Evil 5
Built upon an advanced version of Capcom's proprietary MT Framework game engine to deliver DirectX-10 graphic detail, Resident Evil 5 offers gamers non-stop action similar to Devil May Cry 4, Lost Planet, and Dead Rising. The MT Framework is an exclusive seventh generation game engine built to be used with games developed for the PlayStation 3 and Xbox 360, and PC ports. MT stands for "Multi-Thread", "Meta Tools" and "Multi-Target". Games using the MT Framework are originally developed on the PC and then ported to the other two console platforms.
On the PC version of Resident Evil 5, both DirectX 9 and DirectX-10 modes are available for Microsoft Windows XP and Vista Operating Systems. Microsoft Windows 7 will play Resident Evil with backwards compatible Direct3D APIs. Resident Evil 5 is branded with the NVIDIA The Way It's Meant to be Played (TWIMTBP) logo, and receives NVIDIA GeForce 3D Vision functionality enhancements.
NVIDIA and Capcom offer the Resident Evil 5 benchmark demo for free download from their website, and Benchmark Reviews encourages visitors to compare their own results to ours. Because the Capcom MT Framework game engine is very well optimized and produces high frame rates, Benchmark Reviews uses the DirectX-10 version of the test at 1920x1080 resolution. High quality settings are configured, with 8x MSAA post processing effects for high demand on the GPU. Test scenes from Area #3 and Area #4 require the most graphics processing power, and the results are collected for the chart illustrated below.

Cost Analysis: Resident Evil 5 (Area 4)
- $115 GeForce GTS 250 512MB (9800GTX+) = $3.13 per FPS
- $140 GeForce GTS 450 1GB (MSI Cyclone) = $3.20 per FPS
- $145 Radeon HD 5770 1GB (PowerColor 1GBD5-PPVG2) = $3.74 per FPS
- $260 GeForce GTX 285 1GB = $3.70 per FPS
Test Summary: The Resident Evil 5 benchmark, though also a CAPCOM title, appears to be a little tougher on the GPUs than the Street Fighter IV benchmark. Areas #3 and #4 are the most graphically demanding in this benchmark, so we have charted those two scenes. Area #3 gives us similary results to many of the other DX10 titles, but the less demanding area #4 shows the Radeon HD 5770 with the advantage, and by a sizeable margin of nearly 11%. The Resident Evil 5 tests looks a lot like the 3DMark Vantage test in that the more graphically challenging area is harder on the Radeon card while the less demanding area is harder on the MSI N450GTS Cyclone. Even with the advantage, however, the slightly lower price of the MSI GTS 450 gives it a better price per FPS. Let's take a look at some DX11 titles before we make a final decision on the matter.
|
Graphics Card |
GeForce 9800 GTX+ |
GeForce GTX285 |
GeForce GTS450 |
PowerColorRadeon HD 5770 PPG |
|
GPU Cores |
128 |
240 |
192 |
800 |
|
Core Clock (MHz) |
740 |
670 |
850 |
875 |
|
Shader Clock (MHz) |
1836 |
1550 |
1700 |
N/A |
|
Memory Clock (MHz) |
1100 |
1300 |
1000 |
1225 |
|
Memory Amount |
512 MB GDDR3 |
1024MB GDDR3 |
1024MB GDDR3 |
1024MB GDDR5 |
|
Memory Interface |
256-bit |
512-bit |
128-bit |
128-bit |
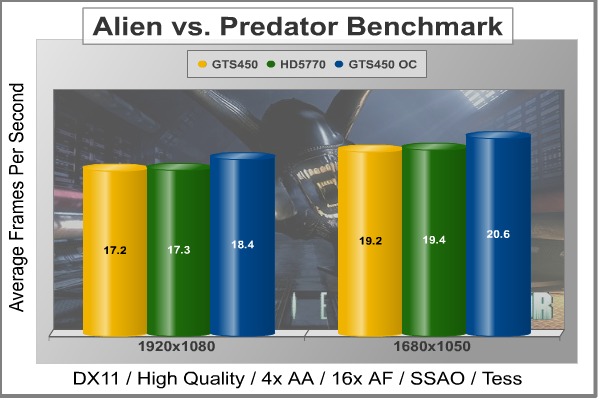
DX11: Aliens vs Predator
Aliens vs. Predator is a science fiction first-person shooter video game, developed by Rebellion, and published by Sega for Microsoft Windows, Sony PlayStation 3, and Microsoft Xbox 360. Aliens vs. Predator utilizes Rebellion's proprietary Asura game engine, which had previously found its way into Call of Duty: World at War and Rogue Warrior. The self-contained benchmark tool is used for our DirectX-11 tests, which push the Asura game engine to its limit.
In our benchmark tests, Aliens vs. Predator was configured to use the medium quality settings with 4x AA and 16x AF. DirectX-11 features such as Screen Space Ambient Occlusion (SSAO) and tessellation have also been included.
Cost Analysis: Aliens vs Predator (1920x1080)
- $140 GeForce GTS 450 1GB (MSI Cyclone) = $8.14 per FPS
- $145 Radeon HD 5770 1GB (PowerColor 1GBD5-PPVG2) = $8.38 per FPS
Test Summary: In our first DX11 title, our two DX11 cards are running neck and neck. This time the results are well within the margin of error and it seems that both cards are equal. It is only after we overclocked the MSI N450GTS Cyclone even more than it was already that it began to pull ahead. From our first DX11 offering, it looks like the MSI N450GTS Cyclone might be a great choice if you deal mostly with DX10 titles, but the tables are evened when DX11 comes into play. Still, the slightly lower price of the MSI N450GTS Cyclone gives it a more appealing price per FPS.
|
Graphics Card |
GeForce 9800 GTX+ |
GeForce GTX285 |
GeForce GTS450 |
PowerColorRadeon HD 5770 PPG |
|
GPU Cores |
128 |
240 |
192 |
800 |
|
Core Clock (MHz) |
740 |
670 |
850 |
875 |
|
Shader Clock (MHz) |
1836 |
1550 |
1700 |
N/A |
|
Memory Clock (MHz) |
1100 |
1300 |
1000 |
1225 |
|
Memory Amount |
512 MB GDDR3 |
1024MB GDDR3 |
1024MB GDDR3 |
1024MB GDDR5 |
|
Memory Interface |
256-bit |
512-bit |
128-bit |
128-bit |
DX11: Battlefield Bad Company 2
The Battlefield franchise has been known to demand a lot from PC graphics hardware. DICE (Digital Illusions CE) has incorporated their Frostbite-1.5 game engine with Destruction-2.0 feature set with Battlefield: Bad Company 2. Battlefield: Bad Company 2 features destructible environments using Frostbit Destruction-2.0, and adds gravitational bullet drop effects for projectiles shot from weapons at a long distance. The Frostbite-1.5 game engine used on Battlefield: Bad Company 2 consists of DirectX-10 primary graphics, with improved performance and softened dynamic shadows added for DirectX-11 users.
At the time Battlefield: Bad Company 2 was published, DICE was also working on the Frostbite-2.0 game engine. This upcoming engine will include native support for DirectX-10.1 and DirectX-11, as well as parallelized processing support for 2-8 parallel threads. This will improve performance for users with an Intel Core-i7 processor. Unfortunately, the Extreme Edition Intel Core i7-980X six-core CPU with twelve threads will not see full utilization.
In our benchmark tests of Battlefield: Bad Company 2, the first three minutes of action in the single-player raft night scene are captured with FRAPS. Relative to the online multiplayer action, these frame rate results are nearly identical to daytime maps with the same video settings.

Cost Analysis: Battlefield: Bad Company 2 (1920x1080)
- $140 GeForce GTS 450 1GB (MSI Cyclone) = $3.41 per FPS
- $145 Radeon HD 5770 1GB (PowerColor 1GBD5-PPVG2) = $3.74 per FPS
Test Summary: Even with these high settings, Battlefield: Bad Company 2 is playable with both DX11 video cards in our test bed. The MSI N450GTS Cyclone takes the lead once again in this benchmark, beating the Radeon HD 5770 by about 6% at 1920x1080 and by about 5% at 1690x1050. It appears as though this test agrees with the Calico test and gives the advantage to the slightly less expensive MSI N450GTS Cyclone.
|
Graphics Card |
GeForce 9800 GTX+ |
GeForce GTX285 |
GeForce GTS450 |
PowerColorRadeon HD 5770 PPG |
|
GPU Cores |
128 |
240 |
192 |
800 |
|
Core Clock (MHz) |
740 |
670 |
850 |
875 |
|
Shader Clock (MHz) |
1836 |
1550 |
1700 |
N/A |
|
Memory Clock (MHz) |
1100 |
1300 |
1000 |
1225 |
|
Memory Amount |
512 MB GDDR3 |
1024MB GDDR3 |
1024MB GDDR3 |
1024MB GDDR5 |
|
Memory Interface |
256-bit |
512-bit |
128-bit |
128-bit |
DX11: Lost Planet 2
A decade has passed since the first game, and the face of E.D.N. III has changed dramatically. Terra forming efforts have been successful and the ice has begun to melt, giving way to lush tropical jungles and harsh unforgiving deserts. Players will enter this new environment and follow the exploits of their own customized snow pirate on their quest to seize control of the changing planet.
Test A
The primary purpose of Test A is to give an indication of typical game play performance of the PC running Lost Planet 2. (i.e. if you can run Mode A smoothly, the game will be playable at a similar condition). In this test, the character's motion is randomized to give a slightly different outcome each time.
Test B
The primary purpose of Test B is to push the PC to its limits and to evaluate the maximum performance of the PC. It utilizes many functions of Direct X11 resulting in a very performance-orientated, very demanding benchmark mode. (Information obtained from the Lost Planet 2 website)

Cost Analysis: Lost Planet 2 (1920x1080)
- $140 GeForce GTS 450 1GB (MSI Cyclone) = $6.06 per FPS
- $145 Radeon HD 5770 1GB (PowerColor 1GBD5-PPVG2) = $5.54 per FPS
Test Summary: The Lost Planet 2 benchmarks are extremely demanding on our video cards. Even with the settings tuned down from their maximum levels, we can only get close to playable frame rates. It seems the CAPCOM titles are pretty much split down the middle between the MSI N450GTS Cyclone and the Radeon HD 5770 in our test bed. The Radeon HD 5770 outpaces the MSI N450GTS Cyclone at both resolutions nearly 16% and 17% respectively. Even when overclocked above the factory settings, the MSI N450GTS can't quite reach the levels of the Radeon HD 5770.
|
Graphics Card |
GeForce 9800 GTX+ |
GeForce GTX285 |
GeForce GTS450 |
PowerColorRadeon HD 5770 PPG |
|
GPU Cores |
128 |
240 |
192 |
800 |
|
Core Clock (MHz) |
740 |
670 |
850 |
875 |
|
Shader Clock (MHz) |
1836 |
1550 |
1700 |
N/A |
|
Memory Clock (MHz) |
1100 |
1300 |
1000 |
1225 |
|
Memory Amount |
512 MB GDDR3 |
1024MB GDDR3 |
1024MB GDDR3 |
1024MB GDDR5 |
|
Memory Interface |
256-bit |
512-bit |
128-bit |
128-bit |
DX11: Unigine Heaven 2.2
The Unigine "Heaven 2.1" benchmark is a free publicly available tool that grants the power to unleash the graphics capabilities in DirectX-11 for Windows 7 or updated Vista Operating Systems. It reveals the enchanting magic of floating islands with a tiny village hidden in the cloudy skies. With the interactive mode, emerging experience of exploring the intricate world is within reach. Through its advanced renderer, Unigine is one of the first to set precedence in showcasing the art assets with tessellation, bringing compelling visual finesse, utilizing the technology to the full extend and exhibiting the possibilities of enriching 3D gaming.
The distinguishing feature in the Unigine Heaven benchmark is a hardware tessellation that is a scalable technology aimed for automatic subdivision of polygons into smaller and finer pieces, so that developers can gain a more detailed look of their games almost free of charge in terms of performance. Thanks to this procedure, the elaboration of the rendered image finally approaches the boundary of veridical visual perception: the virtual reality transcends conjured by your hand. The "Heaven" benchmark excels at providing the following key features:
- Native support of OpenGL, DirectX 9, DirectX-10 and DirectX-11
- Comprehensive use of tessellation technology
- Advanced SSAO (screen-space ambient occlusion)
- Volumetric cumulonimbus clouds generated by a physically accurate algorithm
- Dynamic simulation of changing environment with high physical fidelity
- Interactive experience with fly/walk-through modes
- ATI Eyefinity support

Cost Analysis: Unigine Heaven DX11 (1920x1080)
- $140 GeForce GTS 450 1GB (MSI Cyclone) = $9.15 per FPS
- $145 Radeon HD 5770 1GB (PowerColor 1GBD5-PPVG2) = $10.74 per FPS
Test Summary: The DX11 Unigine Heaven benchmark is another extremely demanding title that doesn't allow either of these cards playable frame rates at these settings. The Heaven benchmark differs from the Lost Planet 2 benchmark, however, and gives the advantage to the NVIDIA GPU. The MSI N450GTS Cyclone comes out ahead of the Radeon HD 5770 by 13% at 1920x1080 and by 9% at 1680x1050. Even with the advantage, the frame rates are within a couple of FPS between the two cards. The main advantage the MSI N450GTS Cyclone holds at this point is that is a few dollars less expensive.
|
Graphics Card |
GeForce 9800 GTX+ |
GeForce GTX285 |
GeForce GTS450 |
PowerColorRadeon HD 5770 PPG |
|
GPU Cores |
128 |
240 |
192 |
800 |
|
Core Clock (MHz) |
740 |
670 |
850 |
875 |
|
Shader Clock (MHz) |
1836 |
1550 |
1700 |
N/A |
|
Memory Clock (MHz) |
1100 |
1300 |
1000 |
1225 |
|
Memory Amount |
512 MB GDDR3 |
1024MB GDDR3 |
1024MB GDDR3 |
1024MB GDDR5 |
|
Memory Interface |
256-bit |
512-bit |
128-bit |
128-bit |
MSI N450GTS Cyclone Temperatures
Benchmark tests are always nice, so long as you care about comparing one product to another. But when you're an overclocker, gamer, or merely a PC hardware enthusiast who likes to tweak things on occasion, there's no substitute for good information. Benchmark Reviews has a very popular guide written on Overclocking Video Cards, which gives detailed instruction on how to tweak a graphics cards for better performance. Of course, not every video card has overclocking head room. Some products run so hot that they can't suffer any higher temperatures than they already do. This is why we measure the operating temperature of the video card products we test.
To begin testing, we use GPU-Z to measure the temperature at idle as reported by the GPU. Next we use FurMark's "Torture Test" to generate maximum thermal load and record GPU temperatures at high-power 3D mode. The ambient room temperature remained at a stable 20°C throughout testing.
FurMark does two things extremely well: drive the thermal output of any graphics processor higher than applications of video games realistically could, and it does so with consistency every time. Furmark works great for testing the stability of a GPU as the temperature rises to the highest possible output. The temperatures discussed below are absolute maximum values, and not representative of real-world performance.

MSI N450GTS Cyclone 1GD5/OC Temperatures
The MSI N450GTS Cyclone 1GD5/OC certainly live up to the Cyclone name and runs at stone cold temperatures. It hardly runs above the ambient temperature at idle. Even at full throttle, the temperature only reaches 48 degrees Celsius. That's almost 20 degrees cooler than the PowerColor Radeon HD 5770 we used to test in this article.

You can see from the GPUZ screenshot above that, even when we overclocked the MSI N450GTS Cyclone to 940MHz and stressed the GPU to 99% load, it only reached 49 degrees Celsius. Additionally, the fan speed only made it up to 54% to keep it that cool. MSI has got something going on with their Cyclone feature, and it's working well. This MSI N450GTS Cyclone actually ran quite a bit cooler than even the low profile ASUS GT 430 video card.
VGA Power Consumption
Life is not as affordable as it used to be, and items such as gasoline, natural gas, and electricity all top the list of resources which have exploded in price over the past few years. Add to this the limit of non-renewable resources compared to current demands, and you can see that the prices are only going to get worse. Planet Earth is needs our help, and needs it badly. With forests becoming barren of vegetation and snow capped poles quickly turning brown, the technology industry has a new attitude towards turning "green". I'll spare you the powerful marketing hype that gets sent from various manufacturers every day, and get right to the point: your computer hasn't been doing much to help save energy... at least up until now.
For power consumption tests, Benchmark Reviews utilizes the 80-PLUS GOLD certified Corsair 850W PSU, model TX850W. According to Corsair, this PSU provides 80% efficiency, however our results are not adjusted for consistency. To measure video card power consumption, Benchmark Reviews uses the Kill-A-Watt EZ (model P4460)power meter made by P3 International.
Normally, we would like to take a baseline test without a video card installed in the test system. However, in this test system, the on-board Radeon HD 4290 will auto-enable, even if previously disabled, if there is no other video card present. This poses a problem to getting a baseline for power consumption, so for this article, we will only be showing the power consumption of the system with the video card at idle, and at load. This should let us know how much power the video card can consume. Remember that this test is relative, since more power is consumed by other system components during the FurMark stress test as well. It should show us, however, a good idea of how much total power could be consumed in a media style PC under the harshest of circumstances.
The idle test results are taken while the system rests idle at the Windows 7 login screen. Then we load up FurMark and run the stress test and record the load power consumption after the test has been running for about 10 minutes.
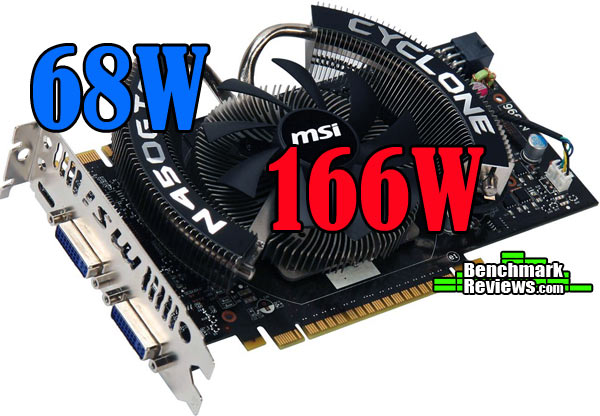
As a disclaimer, our power tests are only meant to give a general idea of how much power you might be using with this video card. The results aren't a hard and fast rule. Hardware issues involved in the testing can also cause the results to vary greatly amongst different systems. Keep this in mind if power consumption is your biggest issue. With the MSI N450GTS Cyclone, we measured a complete system usage of 68W at idle. That number rose by 98W to 166W at full load. With the exact same test system, the Radeon HD 5770 we tested used 96W at idle and 188W at load. From the comparison, it appears as though the MSI N450GTS Cyclone uses less power, both at idle and load, than the Radeon HD 5770.
Overclocking the GTS 450
It took a long time for video cards to really enter into the overclocking world. Sure, you could overclock your GPU, but it took a lot of work. Then one day 3rd party software groups started releasing software utilities specifically for overclocking your video card. At first, many of these utilities were pretty ugly and difficult to use themselves. Soon after, video card manufacturers themselves joined the fray and started releasing their own overclocking software. Now many hardware manufacturers have released a utility and they are much easier to use and look a lot better. In fact, both ATI and NVIDIA have even released their own versions of overclock utilities that are available with their complete driver packages.
The MSI N450GTS Cyclone comes factory overclocked at 850MHz, about 8.5% faster than the GTS 450 stock speed of 783MHz. That's just not good enough for us here at Benchmark Reviews. We have seen the overclock numbers from the reference design GTS 450 and other manufacturers cards, and 850MHz definitely isn't the limit for this GPU. There has got to be more headroom in MSI N450GTS Cyclone, especially with those extremely low operating temperatures.
In addition to NVIDIA's system tools, MSI also offers their own overclocking utility called Afterburner. Many other manufacturers offer their own options, but I thought I'd stick to MSI Afterburner. After all, MSI has gotten a lot right with this card already.

With Afterburner, I was able to modify the GPU Core clock and Shader clock as well as the Memory clock and fan speed. With the N450GTS showing such a great performance in our temperature tests, I left the fan speed on autopilot. I cranked it up to 100% to see how loud it was, of course. While I don't have a decibal meter, the MSI N450GTS Cyclone was somewhat audible at 100% fan speed. At 50%, it was nearly imperceptible. I also left the memory clock alone. The MSI N450GTS Cyclone already comes with the memory overclocked to its rated speed. I didn't mess with that at all. The MSI Afterburner program will allow you to adjust the core voltage of the video card, but I didn't play with this feature either. When you initially try to adjust the voltage, a message will pop up asking you if you are sure you want to go there.
I focused on the Core clock of the MSI N450GTS Cyclone. Starting at the stock 850MHz, I increased the speed by 10MHz at a time. After each increase, I ran the Kombuster app that came bundled with the Afterburner software. You can access the Kombuster app by pressing the little K in the top left corner of the Afterburner interface.

Kombuster is a FurMark application that uses the MSI logo and allows for DX11 features to be enabled. I left Kombuster running at each interval and with the highest possible settings for one hour before moving the Core clock up another 10MHz. When I reached 950MHz, the GPU failed. I scaled back to 945MHz and left Kombuster running for 6 hours. Immediately after that, I ran the Unigine Heaven benchmark at it's highest settings. During the benchmark the MSI N450GTS Cyclone failed again. So I scaled back to 940MHz and left Kombuster running for 9 hours. This time, the MSI N450GTS Cyclone ran through all the benchmarks in our test bed and remained completely solid. You can see the results of the overclocked tests on each of the charts in our testing section.
At 940MHz, our MSI N450GTS Cyclone was nearly 11% faster than the already overclocked stock version and 20% faster than a normal GTS 450. This is very decent overclock and I am pleased with the results.
GeForce GTS 450 Final Thoughts
The Fermi family has been a great comeback for NVIDIA after initially falling behind in the DirectX-11 to the Radeon HD 5000 series. With the GTS 450, NVIDIA puts video cards solidly in the mid-range price segment for consumers. Recently, the prices have dropped on the GTS 450's closest competitor, the Radeon HD 5770, making them even more closely aligned in price to the GTS 450.
The two video cards we used to test in article were both factory overclocked to very similar levels. Their prices were also within $5 of each other. With rebates and discounts, either of these cards is easily available in the $125 range, which makes them that much more valuable.

Throughout the DirectX-10 benchmarks, the MSI N450GTS Cyclone consistently showed better frame rates than the Radeon HD 5770, but only slightly. The price per FPS was also slightly lower for the MSI N450GTS Cyclone. When we got into the DirectX-11 tests, the cards battled back and forth and there was really no clear winner between the two. This is what good competition in manufacturing is all about. Both of these cards compete very well with each other. It is up to the consumer, then, to decide what features special to each side are more important.
The MSI N450GTS Cyclone offers a few things the Radeon HD 5770 can't. CUDA and PhysX compatibility may be a deal breaker if you are interested in these things. PhysX is becoming more popular in games that NVIDIA helps to develop and allows players to immerse themselves in more realistic ways than has ever before been possible. In the new world of 3D vision, NVIDIA was first out of the gate, but AMD has since developed drivers and partnerships that allow its cards to compete in the 3D revolution as well.
While NVIDIA offers PhysX, ATI offers its own set of features such as ATI Eyefinity, allowing three monitors to be powered by a single Radeon HD 5770. You'd need two GTS 450's for that. ATI Avivo HD, Stream acceleration, and PowerPlay are other features that the AMD side brings the table.
So, in the end, it comes down to the features that matter most. If are more interested in an inexpensive three monitor solution, the Radeon HD 5770 could be better for you. If you are looking for eye-popping physical reality, the GTS 450 might be better for you. Overall, both cards offer great game compatibility and very similar performance for the price range that they occupy.
MSI N450GTS Cyclone Conclusion
While the MSI N450GTS Cyclone performed well enough to play most of the titles in our test bed, it only stayed right on pace with the Radeon HD 5770. The DirectX-11 capable card might need some lowered settings in DX11 game titles to acheive playability, but it does offer playability for a good price. The MSI N450GTS stayed ahead of its competition throughout most of the DX10 tests, but those games are slowly leveling out, and playability is playability. If you can get 80 FPS on the Radeon HD 5770, you won't notice the difference in the 83 FPS on the GTS 450. The MSI N450GTS looks forward to the next generation of graphics with NVIDIA 3D capability, as well as PhysX functionality. PhysX is something you just won't find on the other side. The Cyclone products are a legacy product line through MSI that has worked out well for them. It's no different here. The MSI N450GTS provides stone cold operating temperatures and low power consumption.
The Cyclone fan and heatsink combination has always been good looking. The design is sleek and futuristic while still providing great cooling. MSI didn't do anything fancy with the PCB, leaving it basically the same as the reference design. Going away from the full shroud cover of the hotter and higher-end products was a good choice for MSI as far as appearances are concerned.

MSI didn't change a whole on the N450GTS Cyclone where construction is concerned. They pretty much stuck to the reference PCB and VRM design. The construction quality is obviously high level, considering the overclocking performance and power consumption, but was there really nothing they could do to make it better? We expect this high quality construction from all video card manufacturers, but in some cases, manufacturers go beyond our expectations and change things up for better efficiency.
Besides acheiving playable frame rates in most of our tests and running cool under stress, the MSI N450GTS Cyclone offers the functionality that comes with the GeForce 400 series. PhysX and CUDA, as well as NVIDIA 3D, are great additions to just normal gaming and media viewing. HDMI 1.4 is a plus as well. One thing you certainly won't find on the MSI N450GTS Cyclone is triple monitor support offered by ATI Eyefinity. The MSI N450GTS Cyclone comes bundled with a demo code for downloading Starcraft 2. This is nice, but a lot of cards now are coming with full games, not just demos. (Ours came with the Starcraft 2 demo, but NewEgg.com offers it with the full version of HAWX 2.)
Costing $134.99 at Amazon or NewEgg, the MSI N450GTS Cyclone fits right in to the mid-range price segment. The N450GTS Cyclone is a little more expensive than some GTS 450 video cards, but it also comes factory overclocked and runs extremely cold. That price also competes directly with factory overclocked Radeon HD 5770 cards. The price is a normal mid-range price, and you can find the card for around $125 after rebates, but it will nice to see the GTS 450 cards come down a little bit.
Pros:
Cons:
- Price would be nice a little lower
Ratings:
- Performance: 8.25
- Appearance: 9.00
- Construction: 8.50
- Functionality: 9.00
- Value: 7.50
Final Score: 8.45 out of 10.
Questions? Comments? Benchmark Reviews really wants your feedback. We invite you to leave your remarks in our Discussion Forum.
Related Articles:
- Zabcat xplorer˛ File Management Software
- 6GB Kingston HyperX 2000MHz DDR3 Memory Kit
- CM Storm Trooper Computer Case
- ProlimaTech Super Mega Heatsink Preview
- Intel Core i7-980X 6-Core CPU BX80613I7980X
- QNAP TS-409 Pro 4-Drive SATA Gigabit NAS
- Benchmark Reviews Has Moved To WordPress CMS!
- D-Link DNS-323 SATA RAID Gigabit NAS
- Icron USB Ranger 2211 Range Extender
- Xigmatek Utgard CPC-T90DB-U01 Computer Case

Comments
I feel like it's something that I have to be interested in. We don't know how many new game developers will cleave to these standards yet. So buying a card that can't display either one is not the smart choice as I see it. If both ATI and NVIDIA could do both, then the choice would come down to performance and power/heat issues. That isn't the case.
The few games that I have now with CUDA and PhysX enabled are nice eye-candy and I like the technology.
Thanks for another good review.