AMD A-Series A8-3850 Processor Review
Manufacturer: Advanced Micro Devices, Inc. (AMD)
Product Name: A8-3850
Part Number: AD3850WNGXBOX
Price as Tested:$140 at Newegg
Full Disclosure: The product sample used in this article has been provided by AMD, Inc.
When AMD merged with ATI in 2006, they immediately began working on combining discrete level graphics onto the die with an x86 CPU, thus forming an Accelerated Processing Unit (APU). In 2009, AMD expanded on that effort by launching VISION with the intent of shaping the performance of a PC to fit the needs of the user. Five years after the merger, AMD's design has come to fruition in desktop form. In this article, Benchmark Reviews is taking a look at the AMD A-Series A8-3850 APU.
AMD's idea for the need of an APU with discrete level GPU capabilities comes from the high level of demand for media computing. According to YouTube, in April 2011, over 35 hours of video were uploaded every minute with a total of more than 13 million hours of video uploaded during 2010. Those videos don't just get uploaded, of course. They get watched, millions of times. Other media hosting sites have seen similar growth and online TV watching has blossomed as well. Netflix and Hulu are staples in my house, and I know I'm not alone.
AMD isn't the only CPU manufacturer with this idea. Six months ago, we all remember the Intel Sandy Bridge launch. The Sandy Bridge platform also integrated a GPU and a CPU onto the same die. While this had outstanding performance value where media is concerned, other types of PC usage, such as gaming, provided a little more than the Intel HD Graphics could handle. Sure, on low settings, many mainstream games were playable, but even upgrading to a very low-end discrete graphics card increased the playability substantially. With the A-Series platform, combined with the A75 or A55 Fusion Controller Hub (FCH) to make Lynx, AMD purportedly offers discrete level graphics in their on-die GPU. In the A8-3850 we are looking at today, that amounts to a Radeon HD 6550D.
While AMD is running six months behind the Intel launch of their combined GPU/CPU platform, they have included some features that you won't find with the Sandy Bridge. For one, the A-Series APUs are DirectX 11 ready. This is pretty much a must-have if you are going to say that your product is capable of mainstream gaming. Another feature that a lot of us were wondering about when Sandy Bridge was released was native USB 3.0 compatibility. Intel left if off Sandy Bridge; AMD included it in Lynx. Not that it was all that difficult to find a third-party controller, of course. The A-Series also includes AMDs UVD3 and the ability to pair a discrete graphics card with the APU graphics.
The A-Series APUs and Lynx platforms are being priced to compete monetarily near the very bottom end of the Sandy Bridge line. The A8-3850 is set for an MSRP of $135, which is right between the i3-2100 and i3-2105 Sandy Bridge CPUs. As long as the A55 and A75 motherboards are priced in the H67 range, these two platforms will compare nicely in price. In this article, we will compare the A8-3850 with an A75 motherboard to the i3-2100 and an H67 motherboard to see just how the price/performance ratio pans out between these platforms.
A-Series APU Desktop Platform Definition
|
Desktop Platform
|
Description
|
|
Tech/Package
|
32nm / FM1 905-pin lidded μPGA, 40x40 mm, 1.27 mm pitch
|
|
TDP Configurations
|
65W and 100W configurations
|
|
Processor Core
|
"Stars" 32nm HKMG process core (up to 4 cores), 128 KB L1 Cache (64 KB Instruction, 64 KB Data) 1 MB L2/Core, 128-bit FPUs
|
|
Memory
|
Up to DDR3 1866*
|
|
Graphics Core
|
Up to 400 RadeonTM Cores, DirectX® 11 capable, UVD3
|
|
Displays
|
Digital Display I/F DP0: Display Port, HDMI, DVI
Digital Display I/F DP1: Display Port, HDMI, DVI
|
|
Graphics Features
|
AMD Dual Graphics
Blu-ray 3D
AMD Steady Video5
AMD Perfect Picture6
DisplayPort 1.1a, HDMI 1.4a
|
|
Power Management
|
Multiple low-power states
32-nm process for decreased power consumption
PCIe® core power gating
PCIe speed power policy
GPU power gating of RadeonTM Cores and video decode (UVD3)
AMD Turbo Core technology on select models
|
|
AMD A75/AMD A55 FCH
|
|
Tech/Package
|
65nm / FC BGA, 605-Ball, 23x23mm, .8mm pitch
|
|
TDP Configurations
|
A75: 7.8W, A55: 7.6W
|
|
UMI
|
x4 Gen 2
|
|
SATA
|
A75: 6 ports at 6 Gb/s, A55: 6 ports at 3 Gb/s
|
|
RAID
|
0,1,10
|
|
USB
|
A75: 4 USB 3.0 Ports, 10 USB 2.0 Ports, 2 USB 1.1 Internal Ports
A55: 14 USB 2.0 Ports, 2 USB 1.1 Internal Ports
|
|
PCIe GPPs
|
4x1 Gen2
|
|
FIS Support
|
A75 only
|
|
CIR
|
CIR Receiver
|
|
Clock Gen
|
Integrated
|
|
Power Rails
|
SVID for VDDCR_CPU & VDDR_NB, fixed voltage for other rails
|
|
Software/Firmware
|
|
Software
|
Drivers: Windows 7, Windows Vista, Windows XP, Linux
|

- AMD Steady Video - No more headaches from watching shaky hand-held video. AMD Steady Video stabilizes the video during playback so you can actually see the action.
- AMD Radeon Dual Graphics - Combines two powerful AMD Radeon graphics processors to dramatically boost graphics and gaming performance. Get the power of two when you add a qualifying AMD Radeon discrete graphics card for the most extreme visual and
gaming performance.
- AMD Perfect Picture HD - Auto-boosts image quality for enhanced color, contrast and resolution. Experience images and video that you need to see to believe. AMD Perfect Picture HD automatically enhances your images to look bright, clear and vibrant.
- AMD VISION Engine - Accelerate media, productivity and Web browsing
applications along with DirectX 11 support. Enjoy faster Internet browsing on your favorite sites with sharp, crisp images. Enjoy ultra-realistic gaming and immersive visuals.
- Quad-Core Processor - Easily handle productivity and entertainment all at once. More cores allow you to do more and handle complex tasks blazing fast. Enjoy quad-core performance and lightning speed even when you're watching the latest blockbuster movies, video chatting with friends and dominating the newest game.
- AMD Turbo Core Technology - Automatically scales performance on-demand to provide extra performance when you need it most. Amazing performance when you're pushing your system to the limits, with scaled back power consumption for everyday activities.
- AMD Cool 'n' Quiet technology - Reduces heat and noise so you can experience amazing performance without distraction. The sound effects should be coming from the movie you're watching, not your PC. Experience reduced heat and noise so you can enjoy the show.
- Form Factor - Efficient design that's capable of supporting leading
edge, unique desktop form factors. Get amazing HD performance in an
energy-efficient, compact design.
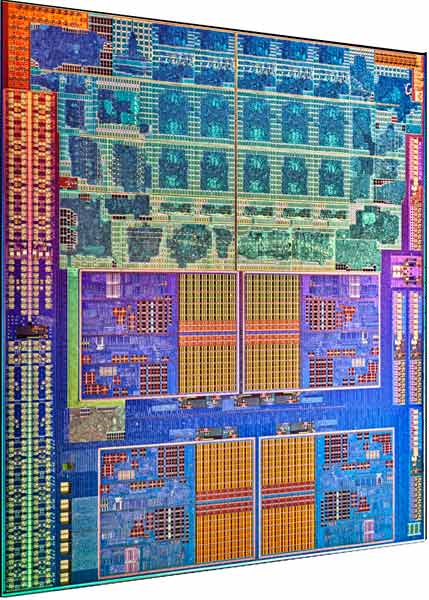
Closer Look: AMD A8-3850 APU
The AMD A-Series A8-3850 is the top end of the APUs being released in mid-2011. The A-Series APUs are similar in build to the Athlon-II X4 series CPUs. They have four CPU cores and 4MB of L2 cache, but no L3 cache. The A-Series APUs are built on 228mm2 die. The APU comes in a little bit of a different package than the AM3 CPUs. The new socket is called FM1 and houses the 905-pin APUs. Another difference is the technology used to build the A-Series APUs. While the AM3 CPUs were built on a 45nm process, the A-Series APUs are built on a 32nm process.

The FM1 is a completely new socket for AMD. With the 990FX chipset, the socket AM3+ is backwards compatible with AM3 processors. The FM1 is a completely new socket. You won't be able to put your old processors in there. You will, however, be able to use your old heatsinks. As it has been for quite a while now, your AM2+/3/3+ heatsinks will fit the new FM1 sockets as well. The Lynx platform also increases the memory speeds supported up to 1866MHz. That's a little higher than the 1333MHz on the Sandy Bridge platform.

For the new 32nm line-up of AMD CPUs, the A-Series represents the lower end. AMD is coming out with the FX series which will represent the higher end. The A-Series, at this point, are limited to quad-core CPUs without an L3 cache. The L2 cache, however, is slightly enhanced with 1MB per core for a total of 4MB. When the FX series of processors is released, we will see 6-Core and 8-Core processors, undoubtedly sporting an L3 cache. Where other specifications are concerned, the A8-3850 has a TDP of 100W, slightly higher than the A8-3800's 65W when it is released. The only other real difference between the two is clock speed and turbo-boost.

The A8-3850 and the A6-3650 are both being released now, with the A8-3800 and A6-3600 being saved for a yet undetermined date. The lower numbered APUs both have significantly lower CPU base clocks, the A8-3800 at 2.4GHz and the A6-3600 at 2.1GHz. Those APUs also have the ability to Turbo up 300MHz faster. The A8-3850 is clocked at 2.9GHz and the A6-3650 at 2.6GHz, but neither of those have the ability to turbo boost. The TDP is higher on the higher numbered processors, up to 100W from 65W.

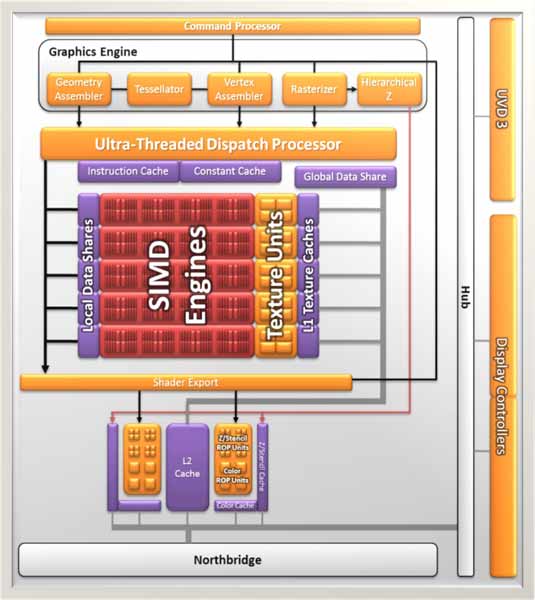
Besides CPU Clock speeds, the A8 series APUs also have a little better GPU. The A6 Vision package includes a Radeon HD 6530D GPU and the A8 Vision package has a Radeon HD 6550D. The 6550D has more Radeon cores, at 400, than the 6530 at 320. Additionally texture units and SIMDs are higher on 6550D, 20 and 5 respectively. The clock speed for the 6550D is 600MHz and the GPU Peak compute is 480 GFLOPS. Overall the GPU on the A8-3850 looks pretty significant, as far as what we are used to seeing in onboard graphics.

Another excellent feature of the A-Series A8-3850 is its ability to pair with a discrete GPU in a Crossfire configuration. The Radeon HD6650D can pair with a 6450, a 6570, or a 6670 to form a Crossfire pair. This can significantly improve the performance of the GPU and, frankly, its something you just won't find with Sandy Bridge. Keeping a system affordable, yet versatile is something features like this can help to provide.
Processor Testing and Results
Before I begin any benchmarking or overclocking, I thoroughly stress the CPU and memory by running Prime95 on all available cores, normally for 12 hours. In this review I stressed them for 6 hours. If no errors are found, I move on to a gaming stress test. To do this, I use Prime95 again to stress the processor, while running an instance of FurMark's stability test on top of this. If the computer survives this test for 2 hours without lockup or corruption, I consider it to be stable and ready for overclocking. After achieving what I feel is stable overclock, I run to these tests again for certainty. The goal of this stress testing is to ensure the clock speeds and settings are stable before performing any benchmarks. I adopted this method from another writer here at Benchmark Reviews and it seems to do a great job of flushing out what only seem to be stable overclocks.

Once the hardware is prepared, we begin our testing. Each benchmark test program begins after a system restart, and the very first result for every test will be ignored since it often only caches the test. This process proves extremely important in many gaming benchmarks, as the first run serves to cache maps allowing subsequent tests to perform much better than the first. Each test is completed five times, with the average results displayed in our article.
Since the A8-3850 competes in price with the i3-2100, we will be looking specifically at the comparison between the two. I have also included other processors for comparison. The Phenom-II X4-840 should be of particular note because it is very close in specifications to the A8-3850.
AMD FM1 A-Series Platform
- Motherboard: ASUS F1A75-M PRO
- Processor: 2.9GHz AMD A-Series A8-3850 APU ($135 MSRP)
- CPU Cooler: Scythe Mugen II
- System Memory: 2x2GB Patriot Gamer Series DDR3
- Primary Drive: Filemate Solid GO 60GB SSD
- Power Supply Unit: Corsair CMPSU-850TX 850W 80-Plus Certified
- Graphics Adapter: APU Radeon HD 6650D; ASUS GT430 (Forceware 275.50)
Intel H67 Test Platforms
- Motherboard: Intel DH67BL with BIOS 1596
- Processor: 3.3GHz (3.7GHz Turbo) Intel Core i5-2500K ($225)
- CPU Cooler: Scythe Yasya
- System Memory: 2x2GB Patriot Gamer Series DDR3 (1333MHz@7-7-7-21)
- Primary Drive: Filemate Solid GO 60GB SSD
- Power Supply Unit: Corsair CMPSU-850TX 850W 80-Plus Certified
- Graphics Adapter: MSI NVIDIA GTS450 Cyclone (Forceware 260.99)
Intel P67 Test Platform
- Motherboard: ASUSSabertooth P67 B3
- Processor: 3.3GHz (3.7GHz Turbo) Intel Core i5-2500K
- CPU Cooler: Scythe Yasya
- System Memory: 2x2GB Patriot Gamer Series DDR3
- Primary Drive: Filemate Solid GO 60GB SSD
- Power Supply Unit: Corsair CMPSU-850TX 850W 80-Plus Certified
- Graphics Adapter: MSI Radeon HD 6870 Twin Frozr III (Catalyst Control Center 11.5)
Intel X58 Test Platform
- Motherboard: MSI X58 Pro LGA1366 Intel X58 ATX
- Processor: 2.66GHz Intel Core i7-920 Bloomfield/Nehalem BX80601920 ($280)
- CPU Cooler: Scythe Mugen II
- System Memory: Kingston 6GB (3 x 2GB) KVR1333D3K3/6GR DDR3 1333MHz (PC3 10666) (CL7-7-7-20)
- Primary Drive: Filemate Solid GO 60GB SSD
- Power Supply Unit: Corsair CMPSU-850TX 850W 80-Plus Certified
- Graphics Adapter: MSI NVIDIA GTS450 Cyclone (Forceware 260.99)
AMD 890GX Test Platform
- Motherboard:Biostar TA890GXB-HD (890GX/SB850)
- Processor: 3.6GHz AMD Phenom-II X4-975BE HDZ980FBK4DGM (MSRP $195)
- Processor: 3.6GHz AMD Phenom-II X4-975BE HDZ980FBK4DGM (MSRP $175 - Adjusted for 980BE release)
- Processor: 3.2GHZ AMD Phenom-II X4-840 HDX840WFK42GM (MSRP $105)
- Processor: 3.3GHz AMD Phenom-II X2-560BE HDZ560WFK2DGM ($110)
- Processor: 3.1GHz AMD Athlon-II X4-645 ADX645WFGMBOX ($110)
- Processor: 3.1GHz AMD Athlon-II X3-445 ADX445WFK32GM (~$79)
- Processor: 3.2GHz AMD Athlon-II X2-260 ADX260OCK23GM ($70)
- CPU Cooler: Scythe Mugen II
- System Memory: 2x2GB Patriot Gamer Series DDR3 (1333MHz@7-7-7-21)
- Primary Drive: Filemate Solid GO 60GB SSD
- Power Supply Unit: Corsair CMPSU-850TX 850W 80-Plus Certified
- Graphics Adapter: MSI NVIDIA GTS450 Cyclone (Forceware 260.99)
AMD 990FX Test Platform
- Motherboard: ASUS Crosshair V Formula (990FX/SB950)
- Processor: 3.7GHz AMD Phenom-II X4-980BE HDZ980FBK4DGM
- System Memory: 2x2GB Patriot Gamer Series DDR3
- Primary Drive: Filemate Solid GO 60GB SSD
- Power Supply Unit: Corsair CMPSU-850TX 850W 80-Plus Certified
- Graphics Adapter: MSI Radeon HD 6870 Twin Frozr III (Catalyst Control Center 11.5)
Benchmark Applications
- Operating System: Windows 7 Professional 64-Bit
- AIDA64 Extreme Edition v1.1
- PassMark PerformanceTest 7.0b1019
- 3DMark Vantage and 3DMark 11
- Futuremark PCMark Vantage v1.0.2.0 64-Bit
- TV and Movies
- Gaming
- Music
- SiSoftware Sandra 2010.1.16.92 CPU Test
- Maxon CINEBENCH R11.5 64-Bit
- Street Fighter IV benchmark
- Resident Evil 5 benchmark
- Lost Planet 2 benchmark
- ArcSoft Media Converter 7
- Handbrake 0.94 video transcoding
AIDA64 Extreme Edition Benchmark Tests
In November, 2010, FinalWire acquired and discontinued Lavalys EVEREST, updated it, and released it as AIDA64. AIDA64 is an industry leading system diagnostics and benchmarking solution for enthusiasts PC users, based on the award-winning EVEREST Technology. During system optimizations and tweaking it provides essential system and overclock information, advanced hardware monitoring and diagnostics capabilities to check the effects of the applied settings. CPU, FPU and memory benchmarks are available to measure the actual system performance and compare it to previous states or other systems. Furthermore, complete software, operating system and security information makes AIDA64 a comprehensive system diagnostics tool that offers a total of 100 pages of information about your PC.

All of the benchmarks used in our test bed rely on basic x86 instructions and consume very low system memory while also being aware of HyperThreading, multi-processors, and multi-core processors. While the AIDA64 CPU tests really only compare the processor performance more than it measures platforms, it still offers a glimpse into what kind of power each platform possesses.
Queen and Photoworxx tests are synthetic benchmarks that operate the function many times and over-exaggerate by several magnitudes what the real-world performance would be like. The Queen benchmark focuses on the branch prediction capabilities and misprediction penalties of the CPU. It does this by finding possible solutions to the classic queen problem on a chessboard. At the same clock speed theoretically the processor with the shorter pipeline and smaller misprediction penalties will attain higher benchmark scores.
Like the Queen benchmark, the Photoworxx tests for penalties against pipeline architecture. The synthetic Photoworxx benchmark stresses the integer arithmetic and multiplication execution units of the CPU and also the memory subsystem. Due to the fact that this test performs high memory read/write traffic, it cannot effectively scale in situations where more than two processing threads are used. The AIDA64 Photoworxx benchmark performs the following tasks on a very large RGB image:
- Fill
- Flip
- Rotate90R (rotate 90 degrees CW)
- Rotate90L (rotate 90 degrees CCW)
- Random (fill the image with random colored pixels)
- RGB2BW (color to black & white conversion)
- Difference
- Crop
I have noticed over time that the Photoworxx test, unlike most of the other AIDA64 tests, depends a lot on the L3 cache. In this test more than any other, the CPUs that have an L3 cache perform a lot better than those that do not. Once again, the Phenom-II X4-975BE tops the AMD CPUs and this time it even outperforms the newly released Core i5-2500 CPU.
The Zip Library test measures combined CPU and memory subsystem performance through the public ZLib compression library. ZLib is designed as a free lossless data compression library for use on virtually any computer hardware and operating system. The ZLib data format is itself portable across platforms and has a footprint independent of input data that can be reduced at some cost in compression.

The AES integer benchmark measures CPU performance using AES data encryption. It utilizes Vincent Rijmen, Antoon Bosselaers and Paulo Barreto's public domain C code in ECB mode and consumes 48 MB of memory.

While I normally like to put both of the Everest integer performance tests on one graph, the Core i5-6500K made that impossible this time. With the new Sandy Bridge processors, Intel made some major changes to the way their CPUs handle AES compression. This new processing is a boon to webmasters everywhere, as well as anyone who deals with encrypted files on a regular basis. With that in mind, the Core i5 processor completely destroys the competition in the AES test.
Next we will take a look at the Passmark Performance Test results.
Passmark Performance Test
PassMark Performance Test is a PC hardware benchmark utility that allows a user to quickly assess the performance of their computer and compare it to a number of standard 'baseline' computer systems. The Passmark Performance Test CPU tests all benchmark the mathematical operations, compression, encryption, SSE, and 3DNow! instructions of modern processors.
In our tests there were several areas of concentration for each benchmark, which are combined into one compound score. This score is referred to as the CPU Mark, and is a composite of the following tests: Integer Math, Floating Point Math, Find Prime Numbers, SSE/3DNow!, Compression, Encryption, Image Rotation, and String Sorting. For this review, we've also decided to run the memory benchmark, which results in a composite score based on the following tests: small block allocation, cached read, uncached read, write performance, and large block allocation.

Up next are the results from the 3DMark Vantage and 3DMark 11 Benchmark tests.
3DMark Vantage Benchmark Tests
3DMark Vantage is a computer benchmark by Futuremark (formerly named Mad Onion) to determine the DirectX 10 performance of 3D game performance with graphics cards. A 3DMark score is an overall measure of your system's 3D gaming capabilities, based on comprehensive real-time 3D graphics and processor tests. By comparing your score with those submitted by millions of other gamers you can see how your gaming rig performs, making it easier to choose the most effective upgrades or finding other ways to optimize your system.
There are two graphics tests in 3DMark Vantage: Jane Nash (Graphics Test 1) and New Calico (Graphics Test 2). The Jane Nash test scene represents a large indoor game scene with complex character rigs, physical GPU simulations, multiple dynamic lights, and complex surface lighting models. It uses several hierarchical rendering steps, including for water reflection and refraction, and physics simulation collision map rendering. The New Calico test scene represents a vast space scene with lots of moving but rigid objects and special content like a huge planet and a dense asteroid belt.
At Benchmark Reviews, we believe that synthetic benchmark tools are just as valuable as video games, but only so long as you're comparing apples to apples. Since the same test is applied in the same controlled method with each test run, 3DMark is a reliable tool for comparing graphic cards against one-another.
Since 3DMark Vantage is tough for even high-end graphics solutions, we have kept things at the lowest level for the Graphics tests here. Using the common resolution of 1280x1024, the minimum settings were applied to 3DMark Vantage include no Anti-Aliasing, no Anisotropic Filtering, all quality levels at Entry Level, and Post Processing Scale at 1:2.
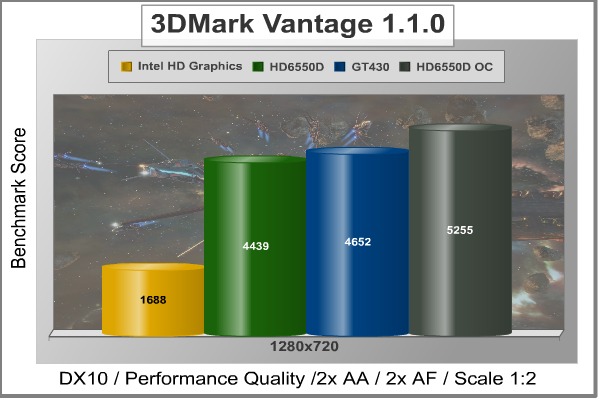
Using 3DMark 11, its hard to compare with the a comparable Intel system, since the Sandy Bridge graphics don't do DX11. But it's nice to see how the A8-3850 compares to low-end discrete DX11 graphics cards.

Next up are the results of the PCMark Vantage Benchmark tests.
PCMark Vantage Benchmark Tests
PCMark Vantage is an objective hardware performance benchmark tool for PCs running 32- and 64-bit versions of Microsoft Windows Vista or Windows 7. PCMark Vantage is well suited for benchmarking any type of Microsoft Windows Vista/7 PC: from multimedia home entertainment systems and laptops, to dedicated workstations and high-end gaming rigs. Benchmark Reviews has decided to use a few select tests from the suite to demonstrate simulated real-world processor usage in this article. Our tests were conducted on 64-bit Windows 7, with results displayed in the chart below.
TV and Movies Suite
- TV and Movies 1 (CPU=50%, RAM=2%, GPU=45%, SSD=3%)
- Two simultaneous threads
- Video transcoding: HD DVD to media server archive
- Video playback: HD DVD w/ additional lower bitrate HD content from HDD, as downloaded from net
- TV and Movies 2 (CPU=50%, RAM=2%, GPU=45%, SSD=3%)
- Two simultaneous threads
- Video transcoding: HD DVD to media server archive
- Video playback, HD MPEG-2: 19.39 Mbps terrestrial HDTV playback
- TV and Movies 3 (SSD=100%)
- TV and Movies 4 (CPU=50%, RAM=2%, GPU=45%, SSD=3%)
- Video transcoding: media server archive to portable device
- Video playback, HD MPEG-2: 48 Mbps Blu-ray playback
Gaming Suite*
- Gaming 1 (CPU=30%, GPU=70%)
- Gaming 2 (SSD=100%)
- Gaming 3 (CPU=75%, RAM=5%, SSD=20%)
- Two simultaneous threads
- CPU game test
- Data decompression: level loading
- Gaming 4 (CPU=42%, RAM=1%, GPU=24%, SSD=33%)
- Three simultaneous threads
- GPU game test
- CPU game test
- HDD: game HDD
Music Suite
- Music 1 (CPU=50%, RAM=3%, GPU=13%, SSD=34%)
- Three simultaneous threads
- Web page rendering - w/ music shop content
- Audio transcoding: WAV -> WMA lossless
- HDD: Adding music to Windows Media Player
- Music 2 (CPU=100%)
- Audio transcoding: WAV -> WMA lossless
- Music 3 (CPU=100%)
- Audio transcoding: MP3 -> WMA
- Music 4 (CPU=50%, SSD=50%)
- Two simultaneous threads
- Audio transcoding: WMA -> WMA
- HDD: Adding music to Windows Media Player
* EDITOR'S NOTE: Hopefully our readers will carefully consider how relative PCMark Vantage is as "real-world" benchmark, since many of the tests rely on unrelated hardware components. For example, per the FutureMark PCMark Vantage White Paper document, Gaming test #2 weighs the storage device for 100% of the test score. In fact, according to PCMark Vantage the video card only impacts 23% of the total gaming score, but the CPU represents 37% of the final score. As our tests in this article (and many others) has already proven, gaming performance has a lot more to do with the GPU than the CPU, and especially more than the hard drive or SSD (which is worth 38% of the final gaming performance score).

Moving on, we have results from the SiSoftware Sandra test suite.
SiSoftware Sandra
SiSoftware Sandra (the System ANalyser, Diagnostic and Reporting Assistant) is an information & diagnostic utility. It should provide most of the information (including undocumented) you need to know about your hardware, software and other devices whether hardware or software.
It works along the lines of other Windows utilities, however it tries to go beyond them and show you more of what's really going on. Giving the user the ability to draw comparisons at both a high and low-level. You can get information about the CPU, chipset, video adapter, ports, printers, sound card, memory, network, Windows internals, AGP, PCI, PCI-X, PCIe (PCI Express), database, USB, USB2, 1394/Firewire, etc.
The SANDRA DhryStone and Whetstone tests are CPU tests that run completely within the CPU + cache memory itself. These tests are perfect for seeing general efficiency per processing core. Dhrystone is basically a suite of arithmetic and string manipulating programs and is an older CPU tests. Even so, it remains a simple and accurate way to show RAW CPU processing performance. The whetstone benchmark primarily measures floating-point arithmetic performance.
Video Memory Bandwith tests shows the discrete GPU power of the Radeon HD6650D. It tops the charts, even surpassing the low-end discrete graphics of the GT430. This is interesting, because the Video Memory is the system memory here and the system memory usually scores higher for the Sandy Bridge than for the A-Series.

The video transcode tests show a completely different story. In fact, the A-Series A8-3850 oddly scores even lower than the HD4290 on the 890GX chipset.

In testing the MPix/s of the GPU processes, the A8-3850 more than triples the GPU processing of the i3-2100.

Cinebench R11.5 is a great CPU specific benchmark. Its results are up next.
Cinebench R11.5 Benchmarks
Maxon Cinebench is a real-world test suite that assesses the computer's performance capabilities. Cinebench is based on Maxon's award-winning animation software, Cinema 4D, which is used extensively by studios and production houses worldwide for 3D content creation. Maxon software has been used in blockbuster movies such as Spider-Man, Star Wars, The Chronicles of Narnia and many more. Cinebench Release 11.5 includes the ability to more accurately test the industry's latest hardware, including systems with up to 64 processor threads and the testing environment better reflects the expectations of today's production demands. A more streamlined interface makes testing systems and reading results incredibly straightforward.
The Cinebench R11.5 test scenario uses all of a system's processing power to render a photorealistic 3D scene, "No Keyframes" the viral animation by AixSponza. This scene makes use of various algorithms to stress all available processor cores. The OpenGL graphics card testing procedure uses a complex 3D scene depicting a car chase with which the performance of your graphics card in OpenGL mode is measured. During the benchmark tests the graphics card is evaluated by way of displaying an intricate scene that includes complex geometry, high-resolution textures, and a variety of effects to evaluate the performance across a variety of real-world scenarios.

Next we will take a look at a CPU intensive video game, Street Fighter IV.
Street Fighter IV Benchmark
PC-based video games can depend heavily on the CPU if the attached GPU (Graphics Processing Unit) is less powerful, or the graphics settings are configured so low that they create no strain on the video card and must rely purely on system processing speed; a phenomenon known as CPU-dependence. The opposite is true when the video game has a powerful video card installed, and can handle all graphical demands without receiving assistance from the CPU. Benchmark Reviews has proven consistently that, with a high end GPU in use, frame rates are not often noticeably impacted by changes in processor or RAM.
Capcom's Street Fighter IV is part of the now-famous Street Fighter series that began in 1987. The 2D Street Fighter II was one of the most popular fighting games of the 1990s, and now gets a 3D face-lift to become Street Fighter 4. The Street Fighter 4 benchmark utility was released as a novel way to test your system's ability to run the game. It uses a few dressed-up fight scenes where combatants fight against each other using various martial arts disciplines. Feet, fists and magic fill the screen with a flurry of activity. Due to the rapid pace, varied lighting and the use of music this is one of the more enjoyable benchmarks.
Street Fighter IV uses a proprietary Capcom SF4 game engine, which is enhanced over previous versions of the game. In terms of 3D graphical demand, Street Fighter IV is considered very low-end for most desktop GPUs. While modern desktop computers with discrete graphics have no problem playing Street Fighter IV at its highest graphical settings, integrated and mobile GPUs have a difficult time producing playable frame rates with the lowest settings configured.
While PC games are generally playable regardless of CPU, the Street Fighter IV game is surprisingly dependent on the CPU. That is why it is included here.

Resident Evil 5 Benchmark Results
Built upon an advanced version of Capcom's proprietary MT Framework game engine to deliver DirectX-10 graphic detail, Resident Evil 5 offers gamers non-stop action similar to Devil May Cry 4, Lost Planet, and Dead Rising. The MT Framework is an exclusive seventh generation game engine built to be used with games developed for the PlayStation 3 and Xbox 360, and PC ports. MT stands for "Multi-Thread", "Meta Tools" and "Multi-Target". Games using the MT Framework are originally developed on the PC and then ported to the other two console platforms.
On the PC version of Resident Evil 5, both DirectX 9 and DirectX-10 modes are available for Microsoft Windows XP and Vista Operating Systems. Microsoft Windows 7 will play Resident Evil with backwards compatible Direct3D APIs. Resident Evil 5 is branded with the NVIDIA The Way It's Meant to be Played (TWIMTBP) logo, and receives NVIDIA GeForce 3D Vision functionality enhancements.
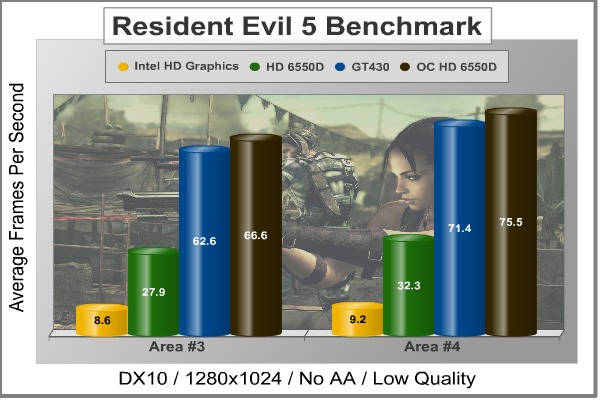
NVIDIA and Capcom offer the Resident Evil 5 benchmark demo for free download from their website, and Benchmark Reviews encourages visitors to compare their own results to ours. Benchmark Reviews uses the DirectX-10 version of the test at 1280x1024 resolution. Low quality settings are configured, with no MSAA post processing effects. Test scenes from Area #3 and Area #4 require the most graphics processing power, and the results are collected for the chart illustrated below.
Lost Planet 2 DX11 Benchmark Results
A decade has passed since the first game, and the face of E.D.N. III has changed dramatically. Terra forming efforts have been successful and the ice has begun to melt, giving way to lush tropical jungles and harsh unforgiving deserts. Players will enter this new environment and follow the exploits of their own customized snow pirate on their quest to seize control of the changing planet.
- 4-player co-op action: Team up to battle the giant Akrid in explosive 4 player co-operative play. Teamwork is the player's key to victory as the team is dependent on each to succeed and survive.
- Single-player game evolves based on players decisions and actions
- Deep level of character customization: Players will have hundreds of different ways to customize their look to truly help them define their character on the battlefield both on- and offline. Certain weapons can also be customized to suit individual player style.
- Beautiful massive environments: Capcom's advanced graphics engine, MT Framework 2.0, will bring the game to life with the next step in 3D fidelity and performance.
- Massive scale of enemies: Players skill on the battlefield and work as a team will be tested like never before against the giant Akrid. Players will utilize teamwork tactics, new weapons and a variety of vital suits (VS) to fight these larger-than-life bosses.
- Rewards System- Players will receive rewards for assisting teammates and contributing to the team's success
- Multiplayer modes and online ranking system
- Exciting new VS features- Based on fan feedback, the team has implemented an unbelievable variety of Vital Suits and new ways to combat VS overall. The new VS sytem will have a powerful impact on the way the player takes to the war zone in Lost Planet 2

The Lost Planet 2 Benchmark is, of course, a DX11 benchmark. The results, while not comparing the A8-3850 to the i3-2100, do show us where the A8-3850 stands on DX11 game benchmarks compared to low-end discrete graphics cards.
Let's take a look at some video transcoding tests next.
Video Transcoding Tests
ArcSoft MediaConverter 7
ArcSoft MediaConverter 7 is a powerful and easy-to-use all-in-one multimedia file converter. This utility quickly and effortlessly converts multimedia files into formats optimized for use on your mobile phone, PMP, TV, and many other popular devices. Newly added is the ability to turn your 2D photos and videos into 3D for playback on supported devices, as well as uploading to YouTube. Your desired media is just one click away! ArcSoft MediaConverter 7 takes advantage of Intel QuickSync when transcoding videos, making it a powerful tool for testing media transcoding capabilities.
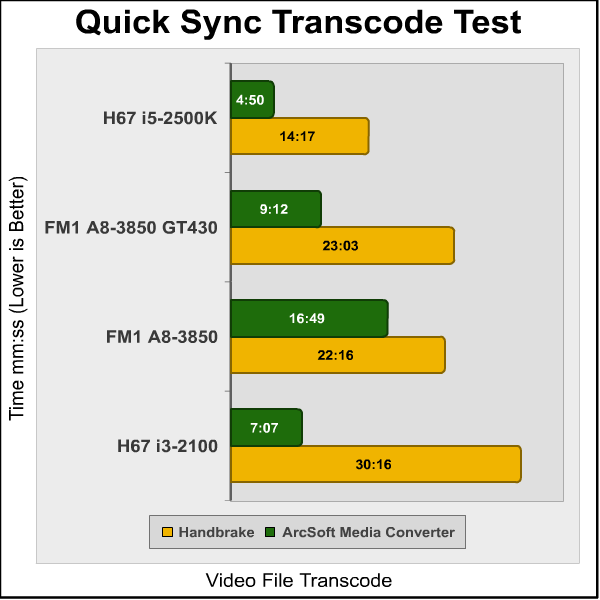
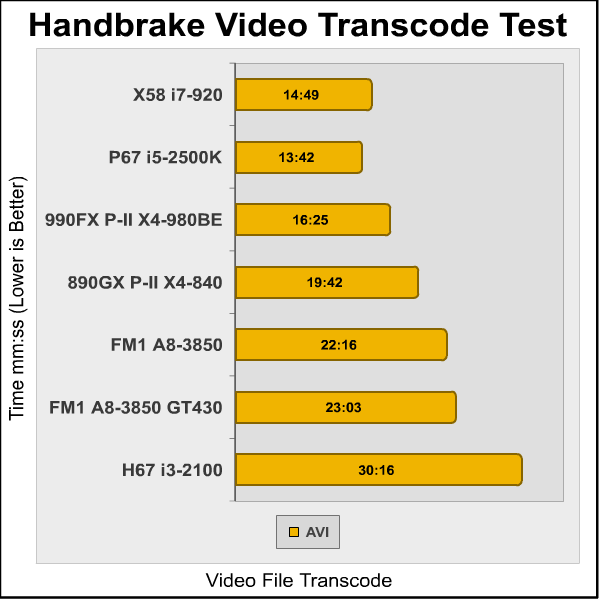
Handbrake 0.9.4 Video Transcoder
HandBrake is an open-source, GPL-licensed, multiplatform, multithreaded video transcoder program designed to convert MPEG video (including DVD-Video) into an MPEG-4 video file in MPEG-4 Part 14 (.mp4) or Matroska (.mkv) containers. The program is used to convert DVDs into other forms so they can be viewed on portable media devices and with most media players. While Handbrake was originally developed for BeOS, it is now available for Linux, Microsoft Windows and Mac OS X.
Handbrake is a readily available program that easily handles and utilizes multiple CPU cores and threads. This makes it an ideal program for us to use to test CPU performance. The amount of time it takes for Handbrake to convert a media file scales very nicely based on the clock speed and available cores of the CPU. For this test, I used a 1.12GB video file in MPEG format to be converted to MP4 format using the "iPhone &iPod Touch" presets. I recorded the total time in (min:sec) that it took to transcode the video file.
That's it for the benchmarks. Let us know what you think below.
A8-3850 Overclocking
Overclocking the Lynx platform is quite a bit more difficult than it was on the previous generation of AMD platforms. The Athlon-II and Phenom-II series of CPUs were excellent overclockers, and it was easy to do. With Black Edition Processors, the CPU multiplier was unlocked and you could crank it up as high as it would go and still boot. This is the best way to overclock the CPU alone, as increasing the reference clock ends up overclocking the RAM and GPU (if one is onboard) as well. On the A-Series APUs, however, the reference clock is the only way to overclock. Overclocking enthusiasts were dismayed when the Sandy Bridge CPUs were locked down tight on the H67 boards and severely limited on the P67 boards. Luckily, the AMD A-Series APUs are not limited to Turbo overclocking only, but, as I said, the only way to overclock them is through increasing the reference clock. The CPU and GPU are completely locked.
With the ASUS F1A75-M PRO motherboard, even overclocking with just the reference clock was a breeze. With the voltage set to AUTO, it automatically increased based on where the reference clock was at. The only tweaking I really had to do was playing around with the numbers to get the highest overclock possible. I also had to tune down the RAM settings because the reference clock hits everything, so the RAM was out of its league while the CPU and GPU were still cooking.
I started off the overclocking by increasing the reference clock from 100MHz to 125MHz. Everything ran solid at that level, so I continued on. At 133MHz I was able to boot into Windows fine, but the stress testing failed. I scaled back 1MHz at a time to 130MHz, where everything past the testing. I had to scale back the RAM a little as well. The RAM I am using is rated for 1600MHz, so overclocked it got a little too high. I scaled back to what would normally be 1333MHz on the RAM so it sat at 1733MHz after the overclock. Here are the results.

3DMark 11 shows a dramatic 51% increase after the overclock. The 3DMark Vantage shows a much lower 18% increase, but that is still quite respectable.

The Sandra Whetstone tests a 32% increase in performance after the overclock, while the Dhrystone tests improve by almost 30%.

The Cinebench Single CPU test performance increased by 30% while the multi-core CPU test increased by 32%.
Overall, the overclocking of the A8-3850, while severly gimped, was still extremely successful in improving the performance of both the CPU and GPU functions of the APU.
Temperature
The A8-3850 runs very cool. This seems to be a trend with 32nm processors and is one that I look forward to the industry enhancing in the future. When testing the temperature of the A8-3850, the ambient temperature stayed at a constant 22 degrees Celsius.
|
Fresh Startup (15 min idle)
|
24 degrees
|
|
After 2hr Netflix Stream
|
37 degrees
|
|
Prime95 & Furmark Stress Test (2hr)
|
51 degrees
|
|
After 24 hours of normal use
|
40 degrees
|
Power Consumption
Power Consumption was very impressive as well. With discrete level graphics, I would have expected a much higher pull from the system. The following is a measure of the power consumption of the complete system at certain points during operation. Measurements were taking with a P3 Kill-A-Watt meter. While these wattages are somewhat low, it is important to note that they are definitely higher than the Sandy Bridge H67 platform with an i5-2500K CPU.
|
Idle
|
48 Watts
|
|
During 2hr Netflix Stream
|
90 Watts
|
|
Gaming
|
117 Watts
|
|
Prime95 & Furmark Stress Test (2hr)
|
162 Watts
|
AMD A8-3850 Final Thoughts
It's been five years in the making, but AMD has finally accomplished what they set out to do when they acquired ATI. Putting discrete level graphics onboard has been something of a hit or miss operation, let alone on die. In January, Intel released the Sandy Bridge Platform, signaling the beginning of this new trend of all-on-one-die processing. The idea was very appealing to media users; an ever-growing market share in the PC industry. Oddly enough, some people don't want to play games on their computers. I know, I was shocked as well.

However, in trying to please everyone, Intel strived to make their 2nd generation Intel HD Graphics able to play mainstream games. In some aspect, they were successful. I reviewed the i5-2500K on an Intel H67 motherboard and on the lowest settings, mainstream games were playable. However, not many gamers want to play on the lowest settings. In addition to gaming, any GPU intensive task was a little difficult for the Intel HD Graphics. That is, except for transcoding. Intel QuickSync made transcoding quick and easy.
But back to gaming. It just wasn't possible on Intel HD Graphics. At least not at the settings that we want to experience it at. So six months later, AMD comes out with a solution. The A-Series APUs are supposed to have discrete level graphics on die. The A8-3850 we tested comes with Radeon HD 6650D graphics. They proved to be quick a bit more adept at GPU intensive processes than the Intel HD Graphics. At the same time, you still have to play on relatively low settings, but it's much more realistic than with the Sandy Bridge CPUs.
At any rate, a serious gamer isn't going to be pleased with the performance of the A8-3850. That being said, it is very nice that you can pair another discrete graphics card with the APU. This is a really cool feature that will allow for an entry-level system to perform quite well in games. With games depending mostly on the GPU anyway, it wouldn't be out of the question to pair a high-level discrete GPU with the A8-3850. That would certainly make all your games playable.
The biggest disappointment to me is that I'm not shocked by the performance of the A8-3850. It outperforms the lowest level i3 Sandy Bridge CPU and the GPU is far ahead of the Intel HD Graphics. That being said, I am still a little disappointed. Here is why. AMD hasn't had the fastest CPU in a long time. The high-end market has eluded them. The sub-$200 price point has been there playground. For the last six months, that hasn't been the case. Before Sandy Bridge, Athlon-II processors were competing with Intel CPUs twice their price. That was stunning performance at entry level prices. The A8-3850 doesn't show me that stunning performance.
Of course, it isn't really that fair to compare it like that either. To get the same CPU performance from an Intel CPU, you wouldn't have to spend much more money. But to get the same CPU performance and GPU performance, you'd have to get a better CPU and a buy a discrete graphics card. When put in that perspective, it is a little more stunning.
AMD A8-3850 Processor Conclusion
IMPORTANT: Although the rating and final score mentioned in this conclusion are made to be as objective as possible, please be advised that every author perceives these factors differently at various points in time. While we each do our best to ensure that all aspects of the product are considered, there are often times unforeseen market conditions and manufacturer changes which occur after publication that could render our rating obsolete. Please do not base any purchase solely on our conclusion, as it represents our product rating specifically for the product tested which may differ from future versions. Benchmark Reviews begins our conclusion with a short summary for each of the areas that we rate. various points in time. While we each do our best to ensure that all aspects of the product are considered, there are often times unforeseen market conditions and manufacturer changes which occur after publication that could render our rating obsolete. Please do not base any purchase solely on our conclusion, as it represents our product rating specifically for the product tested which may differ from future versions. Benchmark Reviews begins our conclusion with a short summary for each of the areas that we rate.
The performance of the AMD A-Series A8-3850 CPU was great for its price range. In most of our testing it outperformed the similarly priced i3-2100. This performance was exaggerated in gaming tests, where the on-die Radeon HD6650D proved much faster than the Intel HD Graphics. At the same time, I am not as impressed with the performance of the A8-3850 as I would like to be. When the Athlon-II processors were competing in price with the i3 Clarkdale and Aarondale CPUs, the performance difference was very noticeable. The AMD CPUs were competing far above their price range. With the A-Series CPUs, I feel like they have succeeded in maintaining the entry-level throne, but not by such a big margin. Besides the Passmark CPU tests, CPU performance was generally slightly above or on par with the Intel CPU, while sometimes dropping below it. I hope the FX series of processors shines a little brighter.
In terms of construction, I am glad to finally see some 32nm chips out from AMD. It has been a long road. Of course, something has to be said of the effort it must have taken to get discrete level graphics on die. With the GPU performance being shown by the off by the Radeon HD6650D, it almost make it seem like Intel launched a little early. The A8-3850 runs consistently cool and has very little trouble being overclocked, both testaments to its construction.
Not only does the A8-3850 offer better performance and better graphics at nearly the same price as the Intel alternative, it comes with a lot of functionality as well. One thing that even mainstream gamers missed in the Intel HD Graphics was DX11 compatibility. AMD fixed this with their A-Series APUs. The Lynx platform offers native USB 3.0, UVD3, and the ability to pair with a second, discrete graphics card. The functionality offered on the A-Series APUs again makes it seem like Intel released their product a little earlier. Six months of market time without any real competition is a lot, but when your product misses the mark in several areas, there is something to be said about patience.
The overclockability of the A8-3850 was very disappointing. We were met with a locked CPU and GPU clock and nothing to do about it. AMD didn't go as far as Intel and make overclocking an impossibility on the lower end platforms, but they did make it extremely difficult. The only way to overclock the A-Series A8-3850 APU is by increasing the reference clock. This increases the entire system, not just the CPU. There isn't any other way of increasing the GPU clock beside using the reference clock either. This makes overclocking very simple, but it can also make it dangerous. You have to be careful that your RAM has a lot of headroom and you have to be careful of voltage. You will have to increase the APU, and possibly RAM voltage to keep with the increases reference clock.
In terms of value, I am torn by the A8-3850. As of early July 2011, the retail AD3850WNGXBOX kit sells for $140 at Newegg. I certainly think it is a better value for many purposes than the Intel i3-2100. Those purpose mainly being GPU driven. However, for transcoding, this isn't the case. Also, we are talking about entry-level systems here. I suppose what I have to say is this; if your main function is web-browsing, streaming media, and a little gaming on the side, the A8-3850 is great for you. If you transcode a lot of media or don't play any games, it's a toss-up. If you are a heavy gamer, don't even bother. You can play games on the A8-3850, but hardcore gamers will want more. Where the market is right now, the A8-3850 is a good deal. I just wish it would have been a little better.
Pros:
+ True Quad-Core CPU/GPU Combo for $135
+ UVD3 Support
+ Virtualization Support
+ DirectX 11 Capable, Discrete Level Graphics
+ Ability to Pair with another Discrete Graphics Card
+ Good Overclocking Headroom
Cons:
- Difficult to Overclock, Limited Ability
Ratings:
- Performance: 8.50
- Construction: 9.00
- Functionality: 9.50
- Overclock: 8.50
- Value: 8.50
Final Score: 8.8 out of 10.
Questions? Comments? Benchmark Reviews really wants your feedback. We invite you to leave your remarks in our Discussion Forum.
Related Articles:
|


Comments
Great review, would of liked it more if you gave more details about your overclocking e.g. multipliers of cpu gpu RAM and how the reference clock affects them etc
-Hank
My 920 is running at 3.8Ghz.
ZLib 237.7
Queen 42591
PhotoWorxx 52680
AES 44529
Julia 12480
Mandel 6069
Sin Julia 5171
Cinebench 5.68 All Cores (Reported 3.62Ghz for some strange reason)
So if I understand correctly, even if the onboard APU isn't powerful enough, you can now add a cheaper card on top of that and the GPU power increases overall? So you could buy an all in one CPU/APU and then add a cheap vid card and perhaps nearly high end graphics capability (Or more modestly, that's the trend)? That's pretty impressive. I will not be sorry to see the days of the must have 500.00USD video card gone.
It's a great idea (in theory) to have integrated graphics on a cpu these days, since modern tower heatsinks provide so much cooling oomph.
Though I know you were talking about cheap cards and cheap graphics, so that's all irrelevant. APU's may see some interesting Overclocking profiles, especially if the Bios options become more developed later on. I think people will be most concerned with overclocking with the purpose of improving memory bandwidth to the GPU, as that seems to be the biggest bottleneck on these chips currently.
It's not for no reason that many tower heatsinks advertise the ability to handle 200-250W.
Pared with a 6570 the 3DMark 11 score nearly doubles which puts it pretty close to a 6770. I am hoping to try it with a 66770 before the show Sunday.
With at least an i7-920 almost everyone can breath silently today and more, it's a solid anchor/pov for everything new on performance side.
And i'm always happy when the monopol spectre fades away.
my last 4 CPU's were 4400x2, FX60, i7-950 and now i7-990X (i'm a little gearslut, i know). My point: don't be an absolute fan of one brand no matter what. Depend of your needs, don't ignore the alternative.
I'm building my own and others PC for maybe 15 years and with a few gaps,i offer both intel and amd solutions, except high end workstations/ultragaming rigs.
if u choose wise, one platform could be trusful for more than 4 years.
For example u need to know two thing to stay in the line: CPU and GPU.
- For CPU, first pick one middle, in the budget, and in one year or more seek for the top CPU of the platform which ussualy cost u less than new mainstream CPU and will perform better than next-gen middle for another 1-2 years.
- for GPU, pick the mainboard with BOTH SLI and XFire. buy 1st one card u can afford, than go dual. Even if u'll choose the second step to go with one more powerfull card from the copmetition, u'll eventually can go dual with 2 top GPU across 2 generation. sometimes 3. And it works.
- Yeah, the RAM, don't go under 6Gs today and PSU, at least 750W GOOOOD brand.
so i really hope AMD will be ok in high end CPU's new generaton.
more the choices, better for us.
BTW, good review.
most sites show that a8-3850 is a bit slower than the 5570 so have something in mind
what a joke release??
an envelod of 100watt??? clearly it eliminates it as an htpc solution.
and since the scores are somewhere the athlon II x4 640
you can use the previous plattform with athlon II x4 620e with an envelop of 45 wat leaving you 55 watt for a gpu. thus not needing to buy a mobo if you are already a holder of an mad system.
a cpu of 45 and a gpu of 55 will means you can go to entirely passive solutions to both. or a an almost silent for the cpu.
so why to have one item that you have to upgraqde both when you can have 2 diferent to upgrade????
so far the assymetric crossfire apu +gpu works unter dx11 and dx10
and dx9 you get worse score than the apu alone!!!!! (maybe amd should look at this and fix it with some new drivers????)
it is a product that is not having any space to breath
since you can go to better alternates even at the amd side
mobo+apu=200 dollars more or less
now there is i3-2100 junior out there 2core/4 thread with a tdp35 watt so how a8-3850 can beat that contestor??? paired with a discrete card??
tdp suks, perfomanse something we have seen nothing spectacular
a product we could do without
as an amd user the last system was from amd i can say i am really disapointed for the outcome of amd is that what amd offer to hit intel?!?!!?!?
what is the market this product aims for??
the a8-3800 with 65 tdp could be discuseed for the lower tdp but i see it will be blown away with intel copmpinations both in tdp and perfomanse :-(
A8 3850's CPU part is faster than Athlon IIx4, clock to clock, by at least 6%.
Athlon IIx4 640+ Radeon HD5570 = 95W+39W = 134W,Llano A8 3850 = 100W with much lower idle power consumption(~44W). No one buys those 'e' or 'T' suffixed under performing parts simply for one obvious reason - PRICE! That junior i3 you mentioned, has a tag of $134 and has the abysmal GPU (HD2000) performance as usual. There is a huge market for entry level budget constrained gaming boxes, Llano will sale like hot-cakes there with a little price-drop. You want a silent, ULV HTPC solution? Go buy a Bobcat system!
well lets see i3 2100 junior 134$ mobo as low as 40$= 174$
a8 115$ mobo 100$+ = 215$ so that leaves you room to buy a gpu 40$
the mobo manufacters got it wrong you do not make 100-150$ mobo for the low end you make 50$ mobo for that cpu and maybe a model at 100$ for the more enthusiast who do not mind to pay some extra so liano need cheaper mobo and a price drop if it wants a share of the market
but the problem remains a8 needs it is own mobo due to his socket
why entrap yourself to a socket of midle to low powered machines when you can go to an am3 solution or am3+ solution now and be ready for bulldozer??? a matx mobo for amd can be found for 40-50$ thus freeing you with some money for the cpu so you can have the mobo and the energy efficient athlon at the same cost you will get today the a8 and his mobo. if you already had a system you can moove you gpu or pay 50-60$ more to get a 5570 and you have the same system as perfomanse with better options. to upgrade.
bobcat is nice but zotac has a mobo out with su2300 thus making it a better option than bobcat.
ion2 is more or less equal to bocat igpu
but su2300 is superion to bobcat in power
power consumption small diferense not that huge and even at idle su2300 wins. so bobcat!?!?!? again it will play role if amd or mobo manufacters drop the price so the bobcat will be more attractive due price only.
thats the only thing left to amd nowdays the complete cheaper but intel is hammering amd hard even at that sector nowdays.
if amd had released liano before intel cpus now we would talk what a failure the intel launch is
but now intel beat amd and he compare her to intel and she looses badly :-(
But as you point out in terms of socket compatibility, this chip is not marketed to people who have an existing AM3 platform, its for new consumers. The socket is a necessary evil at this point, since the AM3 socket is not designed for the extra data needed to deal with the GPU. That said, I would definitely not pay $150 for a Llano motherboard. I'd pay $100 at maximum.
Performance: 8.50
Construction: 9.00
Functionality: 9.50
Overclock: 8.50
Value: 8.50
Final Score: 8.25 ?????out of 10
¡¡¡¡¡8.8!!!!!
AMD Phenom-II X4-975BE Final Thoughts?????
¡¡¡¡¡AMD A8-3850 Lynx Final Thoughts!!!!!
I think the LLANO APUS 65W TDP ,with Turbo Core 2,for HTPC,buros,workstati ons,etc,are the most interesting of use.